Home > Practice > Data Interpretation > Bar Graphs > Miscellaneous
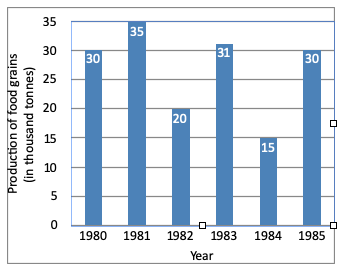
1. The graph shows the production of food grains of a country in different. Study the graph and answer the questions.

The two consecutive years in which rate of change of production of food grains is minimum are.

The two consecutive years in which rate of change of production of food grains is minimum are.
Solution:
From graph it is clear two consecutive years in which rate of change is minimum are 1980 and 1981.