Home > Practice > Data Interpretation > Bar Graphs > Miscellaneous
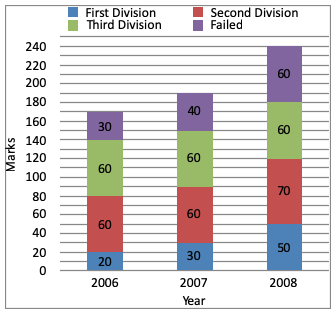
1. The subdivided bar diagram given below depicts the result of B.com students of a college for 3 years. Study the graph and answer the given questions.

What was the number of third division in 2006?
= 140 - 80
= 60

What was the number of third division in 2006?
Solution:
Students who passed in third division in 2006= 140 - 80
= 60