Home > Practice > Data Interpretation > Bar Graphs > Miscellaneous
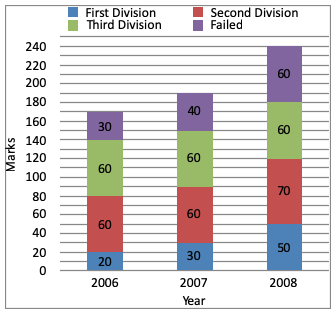
1. The subdivided bar diagram given below depicts the result of B.com students of a college for 3 years. Study the graph and answer the given questions.

In which year, did the college have the best result for B.com?

In which year, did the college have the best result for B.com?
Solution: