Home > Practice > Data Interpretation > Bar Graphs > Miscellaneous
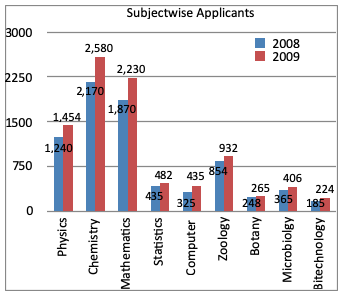
1. The subject wise number of applicants for the year 2008 and 2009 in a college is given in the following chart. study the graph and answer the questions.

The number of Mathematics seeking applicants increased by:

The number of Mathematics seeking applicants increased by:
Solution: