Home > Practice > Data Interpretation > Pie Chart > Miscellaneous
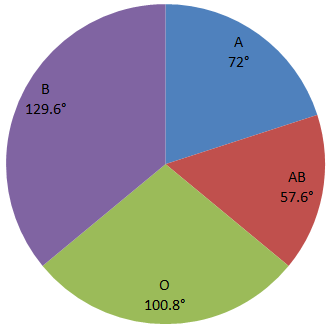
1. This is a pie chart for the data on A, B, O, AB blood groups of 150 donors. Observe the pie chart and answer the questions.

The number of persons having either blood group ‘A’ or blood group ‘B’ is:

The number of persons having either blood group ‘A’ or blood group ‘B’ is:
Solution:
Person having blood group A or B