Home > Practice > Data Interpretation > Pie Chart > Miscellaneous
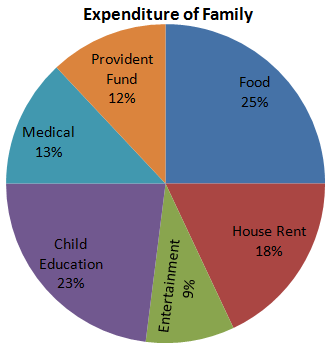
1. Directions (1 - 4): Study the chart and answer the questions: The pie chart given here represents the domestic expenditure of a family in percent. Study the chart and answer the following questions if the total monthly income of the family is Rs. 33,650
The total amount per month, the family spends on food and entertainment combined together, is:
= 34% of Rs. 33650
=
= Rs. 11441
Directions (1 - 4): Study the chart and answer the questions: The pie chart given here represents the domestic expenditure of a family in percent. Study the chart and answer the following questions if the total monthly income of the family is Rs. 33,650

The total amount per month, the family spends on food and entertainment combined together, is:
Solution:
Spent on food and entertainment= 34% of Rs. 33650
=
= Rs. 11441