Home > Practice > Data Interpretation > Pie Chart > Miscellaneous
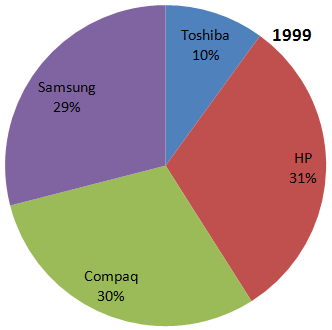
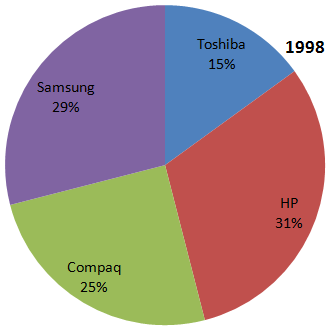
1. Directions (1 - 5): Based on the data given on the pie-chart. Solve the questions which follow :
For which brand of computers, did the sales increase the maximum in terms of absolute value between the two years?
Directions (1 - 5): Based on the data given on the pie-chart. Solve the questions which follow :
Percentage Sales of different models of Computers in Kolkata in two different years . Given total sales in 1998 is 7890 and increase 16.5% in 1999.


For which brand of computers, did the sales increase the maximum in terms of absolute value between the two years?
Solution:
The maximum increase in sales is of Compaq which is 4%. Thus, it will got maximum absolute value too.