Home > Practice > Data Interpretation > Pie Chart > Miscellaneous
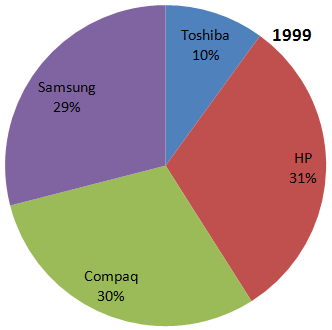
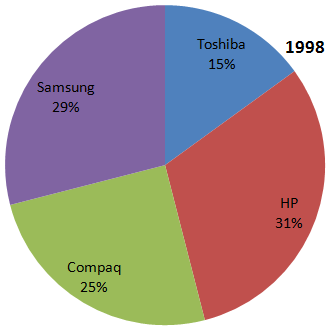
1. Directions (1 - 5): Based on the data given on the pie-chart. Solve the questions which follow :
The percentage change in the sales of Toshiba in 1999 is approximately :
Sales of Toshiba = 12%
=
= 946.8
≈ 947
Total sales in 1999
= 7890 + (16.5% of 7890)
= 9191
Sales of Toshiba
= 8% of 9191
= 735
Change in sales
= 947 - 735
= 212
% change
=
= 21.5%
≈ 22%
Directions (1 - 5): Based on the data given on the pie-chart. Solve the questions which follow :
Percentage Sales of different models of Computers in Kolkata in two different years . Given total sales in 1998 is 7890 and increase 16.5% in 1999.


The percentage change in the sales of Toshiba in 1999 is approximately :
Solution:
Total sales in 1998 = 7890Sales of Toshiba = 12%
=
= 946.8
≈ 947
Total sales in 1999
= 7890 + (16.5% of 7890)
= 9191
Sales of Toshiba
= 8% of 9191
= 735
Change in sales
= 947 - 735
= 212
% change
=
= 21.5%
≈ 22%