Home > Practice > Data Interpretation > Bar Graphs > Miscellaneous
1. Study the graph and answer the questions:

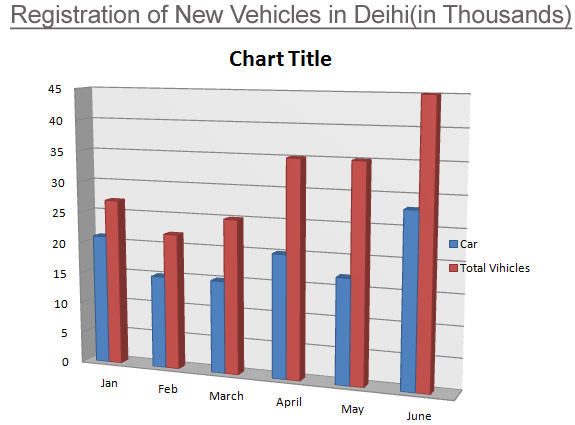
What is the difference between the number of cars registered in January and those registered in June?
= 28 - 21
= 7 thousand

What is the difference between the number of cars registered in January and those registered in June?
Solution:
Registered increase= 28 - 21
= 7 thousand