Home > Practice > Data Interpretation > Bar Graphs > Miscellaneous
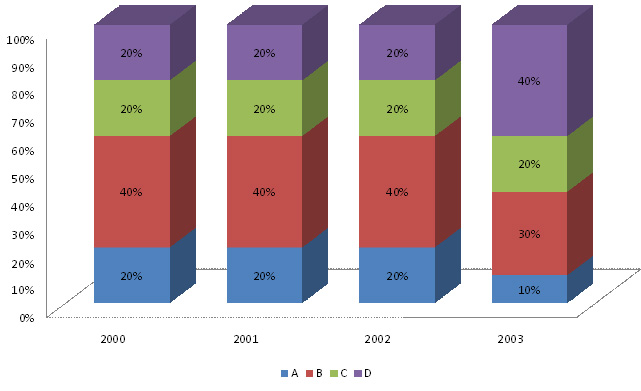
1. The cumulative bar chart below gives us the production of four Products A, B, C and D for four years. It is known that the total production increases @20% over its value in the previous year. The difference between C's production in 2003 and A's production in 2001 is 2640 units.
Production of A, B, C and D.

Assuming no pile up of inventory at the beginning or the end of the year, what is the ratio of the number of units of C produced in these four years?
Then,
0.2 × 17280 - 0.2 × 12000 = 1056
But this difference is given as 2640. Hence, the value of production will be; 25000, 30000, 36000, and 43200 respectively for the 4 years.
Ratio of the number of units C produced in four year,
= 0.2 × 25000 : 0.2 × 30000 : 0.2 × 36000 : 0.2 × 43200
= 250 : 300 : 360 : 432
= 175 : 150 : 180 : 216
Production of A, B, C and D.

Assuming no pile up of inventory at the beginning or the end of the year, what is the ratio of the number of units of C produced in these four years?
Solution:
Assume the total production of the first year as 10000, second year becomes 12000, third year 14400 and fourth year 17280.Then,
0.2 × 17280 - 0.2 × 12000 = 1056
But this difference is given as 2640. Hence, the value of production will be; 25000, 30000, 36000, and 43200 respectively for the 4 years.
Ratio of the number of units C produced in four year,
= 0.2 × 25000 : 0.2 × 30000 : 0.2 × 36000 : 0.2 × 43200
= 250 : 300 : 360 : 432
= 175 : 150 : 180 : 216