Home > Practice > Data Interpretation > Bar Graphs > Miscellaneous
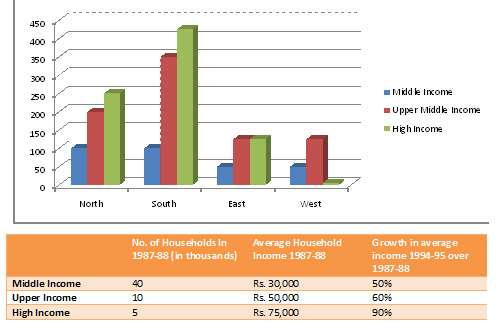
1. The following bar chart gives the growth percentage in the number of households in middle, upper-middle and high-income categories in the four regions for the period between 1987-88 and 1994-95.

What is the percentage increase in total number of households for the northern region (upper-middle) over the given period ?

What is the percentage increase in total number of households for the northern region (upper-middle) over the given period ?
Solution:
The percentage increase in total number of households for the northern region for upper-middle income category is 200%.