Home > Practice > Data Interpretation > Bar Graphs > Miscellaneous
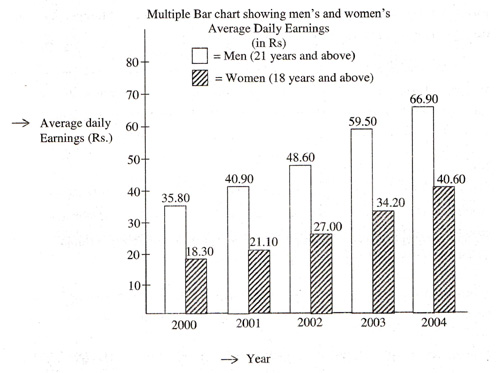
1. The following is a multiple bar chart showing men's and women's average daily earnings in certain industries. Study the chart and answer the questions given below.

In which year is the percentage increase in the average daily earnings of men over the preceding year, the maximum ?
Thus, maximum increase in daily earning of men over preceding year is in 2003

In which year is the percentage increase in the average daily earnings of men over the preceding year, the maximum ?
Solution:
Thus, maximum increase in daily earning of men over preceding year is in 2003