Home > Practice > Data Interpretation > Tabulation > Miscellaneous
1. The proportion of male student and proportion of vegetarian in a school are given below. The school has a total of 800 students, 80% of whom are in the Secondary Section and rest equally divided between Class 11 and 12.

What is the percentage of vegetarian students in class 12?
No. of students in secondary = 80% of 800 = 640
Rest Students = 800 - 640 = 160
Rest students are divided equally into class 12 and 11. So,
No. of students in class 12 = = 80
Now, total vegetarian = 53%
No. of Total vegetarian = 53% of 800 = 424
55% of secondary students are vegetarian.
No. of vegetarian in secondary = 55% of 640 = 352
No. vegetarian in 11 = 50% of 80 = 40
Thus, no. of vegetarian in 12,
= 424 - 352 - 40 = 32
Thus,
In class 12 total vegetarian = 32.
So, % of vegetarian = × 100 = 40%

What is the percentage of vegetarian students in class 12?
Solution:
Total Students = 800No. of students in secondary = 80% of 800 = 640
Rest Students = 800 - 640 = 160
Rest students are divided equally into class 12 and 11. So,
No. of students in class 12 = = 80
Now, total vegetarian = 53%
No. of Total vegetarian = 53% of 800 = 424
55% of secondary students are vegetarian.
No. of vegetarian in secondary = 55% of 640 = 352
No. vegetarian in 11 = 50% of 80 = 40
Thus, no. of vegetarian in 12,
= 424 - 352 - 40 = 32
Thus,
In class 12 total vegetarian = 32.
So, % of vegetarian = × 100 = 40%
2. The proportion of male student and proportion of vegetarian in a school are given below. The school has a total of 800 students, 80% of whom are in the Secondary Section and rest equally divided between Class 11 and 12.

In class 12, twenty five percent of the vegetarian are male. What is the difference between number of female vegetarian and male non-vegetarian?
Difference = 24 - 8 = 16

In class 12, twenty five percent of the vegetarian are male. What is the difference between number of female vegetarian and male non-vegetarian?
Solution:
Male vegetarian = 32 - 8 = 24Difference = 24 - 8 = 16
3. The proportion of male student and proportion of vegetarian in a school are given below. The school has a total of 800 students, 80% of whom are in the Secondary Section and rest equally divided between Class 11 and 12.

What is the percentage of male students in Secondary Section?
= × 100 [∵ 800 × 80% = 640]
= 45%

What is the percentage of male students in Secondary Section?
Solution:
% of male students in secondary section,= × 100 [∵ 800 × 80% = 640]
= 45%
4. Study the table and answer the questions:
The table given here

What is the overall average of marks in the four subjects in the year 2009?
The table given here

What is the overall average of marks in the four subjects in the year 2009?
Solution:
5. Study the table and answer the questions:
The table given here

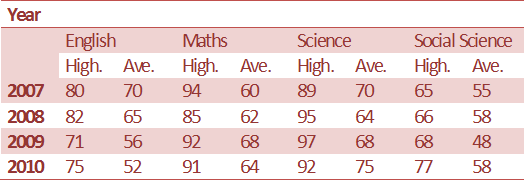
Supposing that there were 40 students in science in the year 2009. How much total of marks did they receive combined together?
= 40 × 68
= 2720
The table given here

Supposing that there were 40 students in science in the year 2009. How much total of marks did they receive combined together?
Solution:
Total marks= 40 × 68
= 2720
6. Study the table and answer the questions:
The table given here

In which year, the difference between the highest and the average marks in Maths was maximum?
The table given here

In which year, the difference between the highest and the average marks in Maths was maximum?
Solution:
Difference in 2007 is 34 which is maximum.
7. Study the table and answer the questions:
The table given here

In which year, the difference between the highest and the average marks in Social Science was least?
The table given here

In which year, the difference between the highest and the average marks in Social Science was least?
Solution:
Difference in 28 is minimum in 2008 i.e. 8.
8. Study the following table and answer the questions.

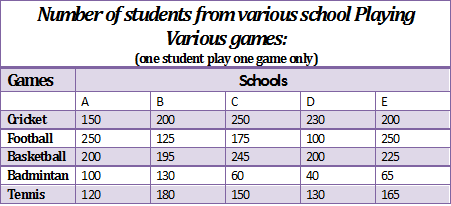
The difference between the total number of students playing Basketball from the all schools and the total number of students playing Cricket from all the schools is:
= (200 + 195 + 245 + 200 + 225) - (150 + 200 + 250 + 230 + 200)
= 1065 - 1030
= 35

The difference between the total number of students playing Basketball from the all schools and the total number of students playing Cricket from all the schools is:
Solution:
Required difference,= (200 + 195 + 245 + 200 + 225) - (150 + 200 + 250 + 230 + 200)
= 1065 - 1030
= 35
9. Study the following table and answer the questions.

The number of students playing Football from School C is x percent of the total number of students playing Football from all the schools x equals:

The number of students playing Football from School C is x percent of the total number of students playing Football from all the schools x equals:
Solution:
10. Study the following table and answer the questions.

Which school has maximum number of players?
A = 820, B = 830, C = 880, D = 700 and E = 905
Hence, The school, which has the maximum number of players is E.

Which school has maximum number of players?
Solution:
Here,A = 820, B = 830, C = 880, D = 700 and E = 905
Hence, The school, which has the maximum number of players is E.
Previous