Home > Practice > Data Interpretation > Pie Chart > Miscellaneous
11. Directions (1 - 5): Based on the data given on the pie-chart. Solve the questions which follow :
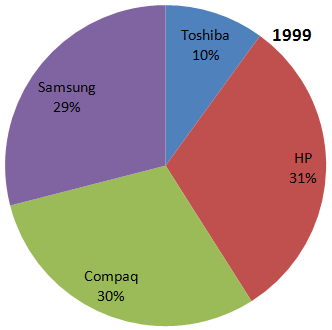
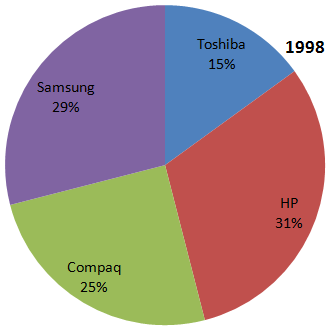
Which brand of computers among those shown, exhibited the second highest rate of growth in two years and had less sales in 1999 than 1998?
Thus, All of these is the correct answer.
Directions (1 - 5): Based on the data given on the pie-chart. Solve the questions which follow :
Percentage Sales of different models of Computers in Kolkata in two different years . Given total sales in 1998 is 7890 and increase 16.5% in 1999.


Which brand of computers among those shown, exhibited the second highest rate of growth in two years and had less sales in 1999 than 1998?
Solution:
There is no percentage change in the given three company.Thus, All of these is the correct answer.
12. Directions (1 - 5): Based on the data given on the pie-chart. Solve the questions which follow :
What is the ratio between the Compaq sales in 1998 and those IBM in 1999?
= 21%
=
=1657
Sales of IBM in 1999,
= 17%
=
= 1562
Ratio = = 1.06
We have calculated total sales in 1999 is 9191 in question no. 1.
Directions (1 - 5): Based on the data given on the pie-chart. Solve the questions which follow :
Percentage Sales of different models of Computers in Kolkata in two different years . Given total sales in 1998 is 7890 and increase 16.5% in 1999.


What is the ratio between the Compaq sales in 1998 and those IBM in 1999?
Solution:
Sale of Compaq in 1998,= 21%
=
=1657
Sales of IBM in 1999,
= 17%
=
= 1562
Ratio = = 1.06
We have calculated total sales in 1999 is 9191 in question no. 1.
13. Directions (1 - 5): Based on the data given on the pie-chart. Solve the questions which follow :
For which brand of computers, did the sales increase the maximum in terms of absolute value between the two years?
Directions (1 - 5): Based on the data given on the pie-chart. Solve the questions which follow :
Percentage Sales of different models of Computers in Kolkata in two different years . Given total sales in 1998 is 7890 and increase 16.5% in 1999.


For which brand of computers, did the sales increase the maximum in terms of absolute value between the two years?
Solution:
The maximum increase in sales is of Compaq which is 4%. Thus, it will got maximum absolute value too.
14. Directions (1 - 5): Based on the data given on the pie-chart. Solve the questions which follow :
IBM's sales in 1998 is what percentage of the sales of Samsung in 1999?
= 17% of 7890
= 1341
Samsung sales in 1999
= 24% of 9191
= 2205
∴ Required answer
=
= 60.8%
Directions (1 - 5): Based on the data given on the pie-chart. Solve the questions which follow :
Percentage Sales of different models of Computers in Kolkata in two different years . Given total sales in 1998 is 7890 and increase 16.5% in 1999.


IBM's sales in 1998 is what percentage of the sales of Samsung in 1999?
Solution:
IBM's sales in 1998= 17% of 7890
= 1341
Samsung sales in 1999
= 24% of 9191
= 2205
∴ Required answer
=
= 60.8%
15. Study the pie chart and answer the given questions.
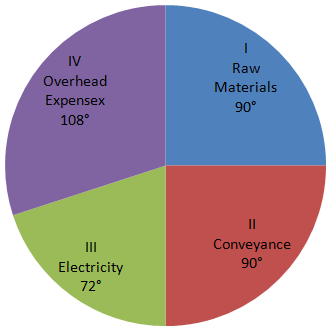
The total expenditure of a company for a particular month is Rs. 60000. The various heads of expenditure I to IV are indicated in a pie chart given below. These heads are:

What percentage of total expenditure is on electricity?
∵ 360° ≡ 100%
∴ Total expenditure on electricity
The total expenditure of a company for a particular month is Rs. 60000. The various heads of expenditure I to IV are indicated in a pie chart given below. These heads are:

What percentage of total expenditure is on electricity?
Solution:
Corresponding angle for expenditure on electricity = 72°∵ 360° ≡ 100%
∴ Total expenditure on electricity
16. Study the pie chart and answer the given questions.
The total expenditure of a company for a particular month is Rs. 60000. The various heads of expenditure I to IV are indicated in a pie chart given below. These heads are:

What percentage of total expenditure is on raw materials?
∵ 360° ≡ 100%
Percentage of raw material
The total expenditure of a company for a particular month is Rs. 60000. The various heads of expenditure I to IV are indicated in a pie chart given below. These heads are:

What percentage of total expenditure is on raw materials?
Solution:
Corresponding angle for raw materials = 90°∵ 360° ≡ 100%
Percentage of raw material
17. Study the pie chart and answer the given questions.
The total expenditure of a company for a particular month is Rs. 60000. The various heads of expenditure I to IV are indicated in a pie chart given below. These heads are:

Total expenditure on conveyance is?
∵ 360° ≡ Rs. 60000
∴ Total expenditure of conveyance
The total expenditure of a company for a particular month is Rs. 60000. The various heads of expenditure I to IV are indicated in a pie chart given below. These heads are:

Total expenditure on conveyance is?
Solution:
Corresponding angle for conveyance = 90°∵ 360° ≡ Rs. 60000
∴ Total expenditure of conveyance
18. Study the pie chart and answer the given questions.
The total expenditure of a company for a particular month is Rs. 60000. The various heads of expenditure I to IV are indicated in a pie chart given below. These heads are:

What is the amount spent on overhead expenses?
∵ 360° ≡ Rs. 60000
Amount spent on overhead expenses
The total expenditure of a company for a particular month is Rs. 60000. The various heads of expenditure I to IV are indicated in a pie chart given below. These heads are:

What is the amount spent on overhead expenses?
Solution:
Corresponding angle for overhead expenses = 108°∵ 360° ≡ Rs. 60000
Amount spent on overhead expenses
19. Refer to the pie-chart and the table carefully and answer the given question.
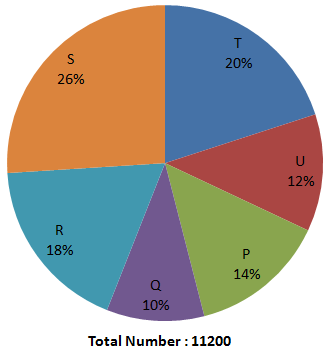
Distribution of total number of cellular phones (both Nokia and Samsung) sold by six stores in October.

Ratio of the number of Nokia cellular phones sold to that of Samsung cellular phone sold.
What is the central angles corresponding to the total number of cellular phones (both Nokia and Samsung) sold by store S?
Percentage of cellular phones (both Nokia and Samsung) sold by Store S = 26%
∴ Required central angle
= × 360
= 93.6°
Distribution of total number of cellular phones (both Nokia and Samsung) sold by six stores in October.

Ratio of the number of Nokia cellular phones sold to that of Samsung cellular phone sold.
| Store | Ratio |
| P | 4 : 3 |
| Q | 3 : 1 |
| R | 5 : 4 |
| S | 7 : 6 |
| T | 1 : 4 |
| U | 11 : 10 |
What is the central angles corresponding to the total number of cellular phones (both Nokia and Samsung) sold by store S?
Solution:
| Store | Nokia Cellular Phones | Samsung Cellular Phones | Total Number of Cellular Phones |
| P | 896 | 672 | 1568 |
| Q | 840 | 280 | 1120 |
| R | 1120 | 896 | 2016 |
| S | 1568 | 1344 | 2912 |
| T | 448 | 1792 | 2240 |
| U | 704 | 640 | 1344 |
Percentage of cellular phones (both Nokia and Samsung) sold by Store S = 26%
∴ Required central angle
= × 360
= 93.6°
20. Refer to the pie-chart and the table carefully and answer the given question.
Distribution of total number of cellular phones (both Nokia and Samsung) sold by six stores in October.

Ratio of the number of Nokia cellular phones sold to that of Samsung cellular phone sold.
What is the average of Nokia cellular phones sold by store P, R, S and T together?
Total Nokia Phone sold by stores P, R, S and T
= 896 + 1120 + 1568 + 448
= 4032
∴ Required average
=
= 1008
Distribution of total number of cellular phones (both Nokia and Samsung) sold by six stores in October.

Ratio of the number of Nokia cellular phones sold to that of Samsung cellular phone sold.
| Store | Ratio |
| P | 4 : 3 |
| Q | 3 : 1 |
| R | 5 : 4 |
| S | 7 : 6 |
| T | 1 : 4 |
| U | 11 : 10 |
What is the average of Nokia cellular phones sold by store P, R, S and T together?
Solution:
| Store | Nokia Cellular Phones | Samsung Cellular Phones | Total Number of Cellular Phones |
| P | 896 | 672 | 1568 |
| Q | 840 | 280 | 1120 |
| R | 1120 | 896 | 2016 |
| S | 1568 | 1344 | 2912 |
| T | 448 | 1792 | 2240 |
| U | 704 | 640 | 1344 |
Total Nokia Phone sold by stores P, R, S and T
= 896 + 1120 + 1568 + 448
= 4032
∴ Required average
=
= 1008