Home > Practice > Data Interpretation > Pie Chart > Miscellaneous
41. Study the following pie-chart and table carefully and answer the questions given below:
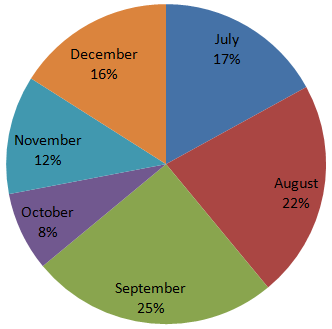
Percentage-wise Distribution of the Number of Mobile phones Sold by a Shopkeeper During Six Months. Ratio of mobile phones sold of Company A & Company B.

If 35% of the mobile phones sold by company A during November were sold at a discount, how many mobile phones of company A were sold without a discount, during that month?
Number of phones sold by A in November without discount
Percentage-wise Distribution of the Number of Mobile phones Sold by a Shopkeeper During Six Months. Ratio of mobile phones sold of Company A & Company B.

| Total number if mobile phones sold = 45000 | |
| Month | Ratio (A : B) |
| July | 8 : 7 |
| August | 4 : 5 |
| September | 3 : 2 |
| October | 7 : 5 |
| November | 7 : 8 |
| December | 7 : 9 |
If 35% of the mobile phones sold by company A during November were sold at a discount, how many mobile phones of company A were sold without a discount, during that month?
Solution:
Number of mobile phones sold by A during NovemberNumber of phones sold by A in November without discount
42. Study the following pie-chart and table carefully and answer the questions given below:
Percentage-wise Distribution of the Number of Mobile phones Sold by a Shopkeeper During Six Months. Ratio of mobile phones sold of Company A & Company B.

What is the total number of mobile phones Sold of company B during August and September together?
Mobile phones of B sold during September
∴ Required number of phones sold
= 5500 + 4500
= 10000
Percentage-wise Distribution of the Number of Mobile phones Sold by a Shopkeeper During Six Months. Ratio of mobile phones sold of Company A & Company B.

| Total number if mobile phones sold = 45000 | |
| Month | Ratio (A : B) |
| July | 8 : 7 |
| August | 4 : 5 |
| September | 3 : 2 |
| October | 7 : 5 |
| November | 7 : 8 |
| December | 7 : 9 |
What is the total number of mobile phones Sold of company B during August and September together?
Solution:
Mobile phones of B sold during AugustMobile phones of B sold during September
∴ Required number of phones sold
= 5500 + 4500
= 10000
43. Study the following pie-charts carefully and answer the questions that follow:
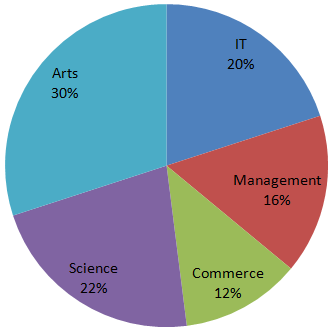
Percentage of Students Enrolled in Different Streams in a College.
Total Number of Students = 3500.

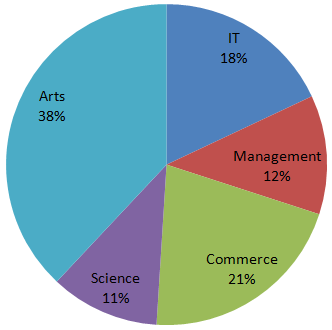
Percentage Break-up of Girls Enrolled in These Streams Out of The Total Students.
Total Number of Girls = 1500.

What is the ratio of the number of girls enrolled in Arts to the number of boys enrolled in Science?
Number of girls enrolled in various streams:
(Number of girls enrolled in Arts) : (Number of boys enrolled in Science)
= 570 : (770 - 165)
= 570 : 605
= 114 : 121
Percentage of Students Enrolled in Different Streams in a College.
Total Number of Students = 3500.

Percentage Break-up of Girls Enrolled in These Streams Out of The Total Students.
Total Number of Girls = 1500.

What is the ratio of the number of girls enrolled in Arts to the number of boys enrolled in Science?
Solution:
Number of students enrolled in various streams:Number of girls enrolled in various streams:
(Number of girls enrolled in Arts) : (Number of boys enrolled in Science)
= 570 : (770 - 165)
= 570 : 605
= 114 : 121
44. Study the following pie-charts carefully and answer the questions that follow:
Percentage of Students Enrolled in Different Streams in a College.
Total Number of Students = 3500.

Percentage Break-up of Girls Enrolled in These Streams Out of The Total Students.
Total Number of Girls = 1500.

The number of girls enrolled in Arts, Science and Commerce forms what percent of total number of students in the college?
Number of girls enrolled in various streams:
Number of girls enrolled in Arts, Science and Commerce
= 570 + 165 + 315
= 1050
Required percentage
Percentage of Students Enrolled in Different Streams in a College.
Total Number of Students = 3500.

Percentage Break-up of Girls Enrolled in These Streams Out of The Total Students.
Total Number of Girls = 1500.

The number of girls enrolled in Arts, Science and Commerce forms what percent of total number of students in the college?
Solution:
Number of students enrolled in various streams:Number of girls enrolled in various streams:
Number of girls enrolled in Arts, Science and Commerce
= 570 + 165 + 315
= 1050
Required percentage
45. Study the following pie-charts carefully and answer the questions that follow:
Percentage of Students Enrolled in Different Streams in a College.
Total Number of Students = 3500.

Percentage Break-up of Girls Enrolled in These Streams Out of The Total Students.
Total Number of Girls = 1500.

What is the total number of girls enrolled in Science and Commerce together?
Number of girls enrolled in various streams:
Total number of girls enrolled in Science and Commerce together
= 165 + 315
= 480
Percentage of Students Enrolled in Different Streams in a College.
Total Number of Students = 3500.

Percentage Break-up of Girls Enrolled in These Streams Out of The Total Students.
Total Number of Girls = 1500.

What is the total number of girls enrolled in Science and Commerce together?
Solution:
Number of students enrolled in various streams:Number of girls enrolled in various streams:
Total number of girls enrolled in Science and Commerce together
= 165 + 315
= 480
46. Study the following pie-charts carefully and answer the questions that follow:
Percentage of Students Enrolled in Different Streams in a College.
Total Number of Students = 3500.

Percentage Break-up of Girls Enrolled in These Streams Out of The Total Students.
Total Number of Girls = 1500.

What is the total number of boys enrolled in Management and IT together?
Number of girls enrolled in various streams:
Total number of boys enrolled in Management and IT together
= (560 - 180) + (700 - 270)
= 380 + 430
= 810
Percentage of Students Enrolled in Different Streams in a College.
Total Number of Students = 3500.

Percentage Break-up of Girls Enrolled in These Streams Out of The Total Students.
Total Number of Girls = 1500.

What is the total number of boys enrolled in Management and IT together?
Solution:
Number of students enrolled in various streams:Number of girls enrolled in various streams:
Total number of boys enrolled in Management and IT together
= (560 - 180) + (700 - 270)
= 380 + 430
= 810
47. Study the following pie-charts carefully and answer the questions that follow:
Percentage of Students Enrolled in Different Streams in a College.
Total Number of Students = 3500.

Percentage Break-up of Girls Enrolled in These Streams Out of The Total Students.
Total Number of Girls = 1500.

If 20% of the girls enrolled in science change their stream to Management, then what will be the new number of Management students altogether?
Number of girls enrolled in various streams:
Number of Management students already enrolled = 560
New required number
Percentage of Students Enrolled in Different Streams in a College.
Total Number of Students = 3500.

Percentage Break-up of Girls Enrolled in These Streams Out of The Total Students.
Total Number of Girls = 1500.

If 20% of the girls enrolled in science change their stream to Management, then what will be the new number of Management students altogether?
Solution:
Number of students enrolled in various streams:Number of girls enrolled in various streams:
Number of Management students already enrolled = 560
New required number
48. Study the pie-chart given below carefully and answer the questions that follow.
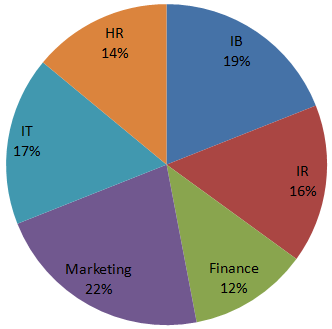
Percentage-wise break up of students in terms of specialization in M.B.A.
Total Number of students = 8000.

Students having IB as specialisation forms approximately what percent of students having Marketing as specialisation?
Percentage-wise break up of students in terms of specialization in M.B.A.
Total Number of students = 8000.

Students having IB as specialisation forms approximately what percent of students having Marketing as specialisation?
Solution:
Number of students in various specialisations:
49. Study the pie-chart given below carefully and answer the questions that follow.
Percentage-wise break up of students in terms of specialization in M.B.A.
Total Number of students = 8000.

Students having IR as specialisation forms approximately what percent of students having HR as specialisation?
Percentage-wise break up of students in terms of specialization in M.B.A.
Total Number of students = 8000.

Students having IR as specialisation forms approximately what percent of students having HR as specialisation?
Solution:
Number of students in various specialisations:
50. Study the pie-chart given below carefully and answer the questions that follow.
Percentage-wise break up of students in terms of specialization in M.B.A.
Total Number of students = 8000.

What is the total number of students having IB as specialisation?
Number of those having IB as specialisation = 1520
Percentage-wise break up of students in terms of specialization in M.B.A.
Total Number of students = 8000.

What is the total number of students having IB as specialisation?
Solution:
Number of students in various specialisations:Number of those having IB as specialisation = 1520