Home > Practice > Data Interpretation > Pie Chart > Miscellaneous
51. Study the pie-chart given below carefully and answer the questions that follow.
Percentage-wise break up of students in terms of specialization in M.B.A.
Total Number of students = 8000.
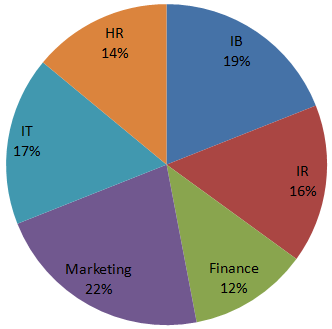
What is the total number of students having specialisation in IR, marketing and IT?
Required number of students
= 1280 + 1760 + 1360
= 4400
Percentage-wise break up of students in terms of specialization in M.B.A.
Total Number of students = 8000.

What is the total number of students having specialisation in IR, marketing and IT?
Solution:
Number of students in various specialisations:Required number of students
= 1280 + 1760 + 1360
= 4400
52. Study the pie-chart given below carefully and answer the questions that follow.
Percentage-wise break up of students in terms of specialization in M.B.A.
Total Number of students = 8000.

What is the ratio of the students having finance as specialisation to students having HR as specialisation?
Percentage-wise break up of students in terms of specialization in M.B.A.
Total Number of students = 8000.

What is the ratio of the students having finance as specialisation to students having HR as specialisation?
Solution:
Number of students in various specialisations:
53. Study the following pie-chart carefully and answer the questions that follow:
Degreewise Break-up of Expenditure of a Family in a month
Total Amount Spent In a Month = Rs. 45800.
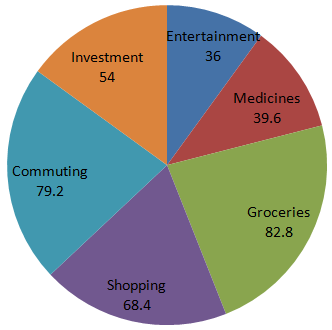
What is the total amount spent by the family on Entertainment and Shopping together?
Amount spent on Entertainment and Shopping
Degreewise Break-up of Expenditure of a Family in a month
Total Amount Spent In a Month = Rs. 45800.

What is the total amount spent by the family on Entertainment and Shopping together?
Solution:
Percentage Break-up of expenditure is:Amount spent on Entertainment and Shopping
54. Study the following pie-chart carefully and answer the questions that follow:
Degreewise Break-up of Expenditure of a Family in a month
Total Amount Spent In a Month = Rs. 45800.

What is the amount spent by the family on commuting?
Degreewise Break-up of Expenditure of a Family in a month
Total Amount Spent In a Month = Rs. 45800.

What is the amount spent by the family on commuting?
Solution:
Percentage Break-up of expenditure is:
55. Study the following pie-chart carefully and answer the questions that follow:
Degreewise Break-up of Expenditure of a Family in a month
Total Amount Spent In a Month = Rs. 45800.

The total amount spent by the family on Groceries, Entertainment and Investment together forms approximately what percent of the amount spent on Commuting?
Amount spent on Groceries, Entertainment and Investments
Degreewise Break-up of Expenditure of a Family in a month
Total Amount Spent In a Month = Rs. 45800.

The total amount spent by the family on Groceries, Entertainment and Investment together forms approximately what percent of the amount spent on Commuting?
Solution:
Percentage Break-up of expenditure is:Amount spent on Groceries, Entertainment and Investments
56. Study the following pie-chart carefully and answer the questions that follow:
Degreewise Break-up of Expenditure of a Family in a month
Total Amount Spent In a Month = Rs. 45800.

What is the ratio of the amount spent by the family on medicine to the amount spent on groceries?
(Amount spent on medicine) : (Amount spent on groceries)
Degreewise Break-up of Expenditure of a Family in a month
Total Amount Spent In a Month = Rs. 45800.

What is the ratio of the amount spent by the family on medicine to the amount spent on groceries?
Solution:
Percentage Break-up of expenditure is:(Amount spent on medicine) : (Amount spent on groceries)
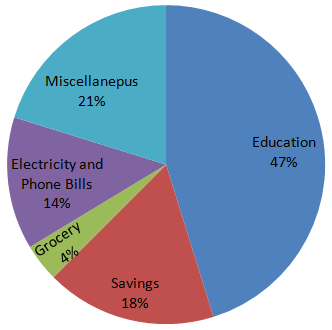
57. In the following question, study the two pie-charts and answer the questions.
April Month's Salary = Rs. 24000.
May Month's Salary = Rs. 25000.
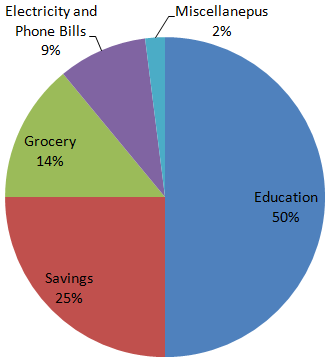
From the salary of May, the amount spent on Grocery and Electricity are:
April Month's Salary = Rs. 24000.

May Month's Salary = Rs. 25000.

From the salary of May, the amount spent on Grocery and Electricity are:
Solution:
58. In the following question, study the two pie-charts and answer the questions.
April Month's Salary = Rs. 24000.

May Month's Salary = Rs. 25000.

What is the percent increase in Education in May month than April month?
April Month's Salary = Rs. 24000.

May Month's Salary = Rs. 25000.

What is the percent increase in Education in May month than April month?
Solution:
59. In the following question, study the two pie-charts and answer the questions.
April Month's Salary = Rs. 24000.

May Month's Salary = Rs. 25000.

The ratio of amount spent for saving in April month’s salary and miscellaneous in May month’s salary is-
= :
= 24 ×18 : 25 × 2
= 216 : 25
April Month's Salary = Rs. 24000.

May Month's Salary = Rs. 25000.

The ratio of amount spent for saving in April month’s salary and miscellaneous in May month’s salary is-
Solution:
Required ratio= :
= 24 ×18 : 25 × 2
= 216 : 25
60. Pie-charts show the expenses on various heads show the expenses on various heads in construction of a house. Study the pie-chart.
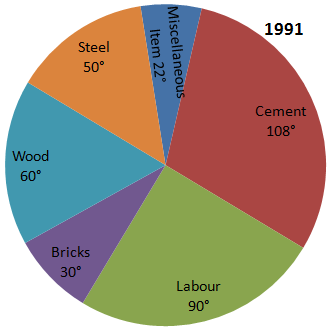
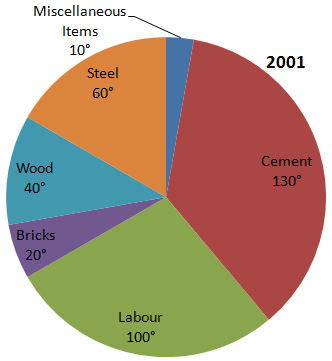
If the total cost of constructing the house is Rs. 3,60,000 in 1991 and Rs. 8,64,000 in 2001, what is the amount spent on Steel in 1991 and 2001?


If the total cost of constructing the house is Rs. 3,60,000 in 1991 and Rs. 8,64,000 in 2001, what is the amount spent on Steel in 1991 and 2001?
Solution: