Home > Practice > Data Interpretation > Pie Chart > Miscellaneous
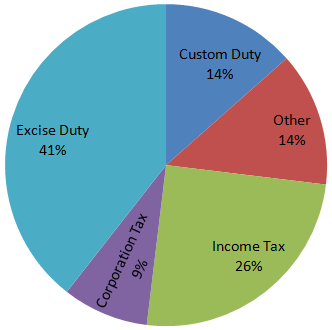
71. Revenue earned by the Central Government is given in pie-chart. Study the pie-chart and answer 4 questions:

The ratio of revenue earned from excise duty and custom duty to that of other is:

The ratio of revenue earned from excise duty and custom duty to that of other is:
Solution:
| Excise duty + custom duty | : | other |
| 41% + 14% | : | 10% |
| 55% | : | 10% |
| 11 | : | 2 |
72. Revenue earned by the Central Government is given in pie-chart. Study the pie-chart and answer 4 questions:

The ratio of revenue of the Central Government earned from the Custom Duty and income tax is-

The ratio of revenue of the Central Government earned from the Custom Duty and income tax is-
Solution:
| Custom duty | : | Income tax |
| 14 | : | 26 |
| 7 | : | 13 |
73. Revenue earned by the Central Government is given in pie-chart. Study the pie-chart and answer 4 questions:

If the income of Central Government from Excise duty is 28,618 crores, then the total revenue earned by the Government is:
Total revenue × = 28618
Total revenue = 28618 ×
= Rs. 69,800 crores

If the income of Central Government from Excise duty is 28,618 crores, then the total revenue earned by the Government is:
Solution:
Excise duty = 41%Total revenue × = 28618
Total revenue = 28618 ×
= Rs. 69,800 crores
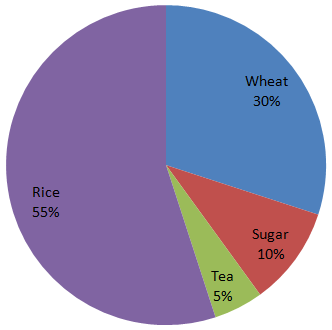
74. In the given pie- chart , the comparative study of the production of rice, wheat, sugar and tea of a country is given. Study the pie- chart and answer the following questions.

The production of Rice, Wheat, Sugar and Tea is 500000 kg. Find the production of Rice.
55% + 30% + 10% + 5% = 500000
then rice 55%

The production of Rice, Wheat, Sugar and Tea is 500000 kg. Find the production of Rice.
Solution:
Rice + Wheat + Sugar + Tea = 50000055% + 30% + 10% + 5% = 500000
then rice 55%
75. In the given pie- chart , the comparative study of the production of rice, wheat, sugar and tea of a country is given. Study the pie- chart and answer the following questions.

The production of rice and tea is more/ greater than production of wheat by-
Wheat = 30° = × 100 = 100%

The production of rice and tea is more/ greater than production of wheat by-
Solution:
Rice + Tea = 55% + 5% = 60%Wheat = 30° = × 100 = 100%
76. In the given pie- chart , the comparative study of the production of rice, wheat, sugar and tea of a country is given. Study the pie- chart and answer the following questions.

The central angle of wheat % is:
1 = 3.6°
30° = 3.6 × 30 = 108°

The central angle of wheat % is:
Solution:
100 = 360°1 = 3.6°
30° = 3.6 × 30 = 108°
77. In the given pie- chart , the comparative study of the production of rice, wheat, sugar and tea of a country is given. Study the pie- chart and answer the following questions.

From this diagram the ratio of sum of wheat and sugar production to difference in production of rice and tea is:

From this diagram the ratio of sum of wheat and sugar production to difference in production of rice and tea is:
Solution:
| (Wheat + Sugar) | : | (Rice - Tea) |
| (30 + 10) | : | (55 - 5) |
| 40 | : | 50 |
| 4 | : | 5 |
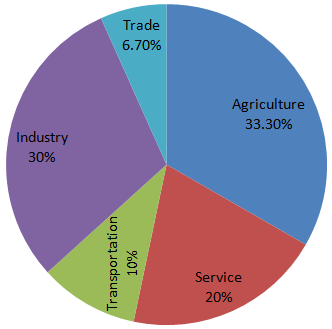
78. Study the pie- chart carefully and answer the questions. The pie- chart represents the percentage of people involved in various occupations.
Total number of people = 20000.

The difference between the maximum number of people involved and minimum number of people involved in various professions is:
Agriculture = 33.30%
Trade = Minimum = 6.70%
Difference = 33.30% - 6.70% = 26.60%
100% = 20000
1% = 200
26.6% = 200 × 26.6
= 5320
Total number of people = 20000.

The difference between the maximum number of people involved and minimum number of people involved in various professions is:
Solution:
Maximum people in any profession - Minimum people involved in any professionAgriculture = 33.30%
Trade = Minimum = 6.70%
Difference = 33.30% - 6.70% = 26.60%
100% = 20000
1% = 200
26.6% = 200 × 26.6
= 5320
79. Study the pie- chart carefully and answer the questions. The pie- chart represents the percentage of people involved in various occupations.
Total number of people = 20000.

How many more people are involved in service than in trade?
= 20% - 6.70%
= 13.3%
= × 20000
= 2660
Total number of people = 20000.

How many more people are involved in service than in trade?
Solution:
People in service sector more than trade= 20% - 6.70%
= 13.3%
= × 20000
= 2660
80. Study the pie- chart carefully and answer the questions. The pie- chart represents the percentage of people involved in various occupations.
Total number of people = 20000.

The sectorial angle made by the people involved in service in the given pie- chart is:
Total number of people = 20000.

The sectorial angle made by the people involved in service in the given pie- chart is:
Solution:
Angle made by service sector