Home > Practice > Data Interpretation > Pie Chart > Miscellaneous
21. Refer to the pie-chart and the table carefully and answer the given question.
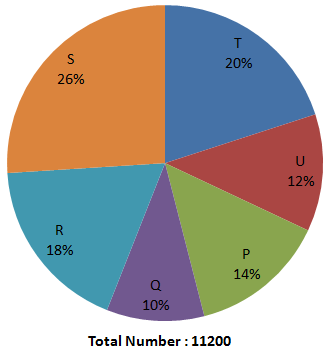
Distribution of total number of cellular phones (both Nokia and Samsung) sold by six stores in October.

Ratio of the number of Nokia cellular phones sold to that of Samsung cellular phone sold.
What is the ratio of the number of Nokia cellular phones sold by store S to the Samsung cellular phones sold by store T and U together?
Number of Nokia phones sold by store S = 1568
Number of Samsung Phones sold by store T and U together
= 1792 + 640
= 2432
Distribution of total number of cellular phones (both Nokia and Samsung) sold by six stores in October.

Ratio of the number of Nokia cellular phones sold to that of Samsung cellular phone sold.
| Store | Ratio |
| P | 4 : 3 |
| Q | 3 : 1 |
| R | 5 : 4 |
| S | 7 : 6 |
| T | 1 : 4 |
| U | 11 : 10 |
What is the ratio of the number of Nokia cellular phones sold by store S to the Samsung cellular phones sold by store T and U together?
Solution:
| Store | Nokia Cellular Phones | Samsung Cellular Phones | Total Number of Cellular Phones |
| P | 896 | 672 | 1568 |
| Q | 840 | 280 | 1120 |
| R | 1120 | 896 | 2016 |
| S | 1568 | 1344 | 2912 |
| T | 448 | 1792 | 2240 |
| U | 704 | 640 | 1344 |
Number of Nokia phones sold by store S = 1568
Number of Samsung Phones sold by store T and U together
= 1792 + 640
= 2432
22. Refer to the pie-chart and the table carefully and answer the given question.
Distribution of total number of cellular phones (both Nokia and Samsung) sold by six stores in October.

Ratio of the number of Nokia cellular phones sold to that of Samsung cellular phone sold.
The number of Nokia cellular phones sold by store R is what percent more than that of Samsung cellular phones sold by store P and Q together?
Number of Nokia phones sold by store R = 1120
Number of Samsung phones sold by store P and Q together
= 672 + 280
= 952
Distribution of total number of cellular phones (both Nokia and Samsung) sold by six stores in October.

Ratio of the number of Nokia cellular phones sold to that of Samsung cellular phone sold.
| Store | Ratio |
| P | 4 : 3 |
| Q | 3 : 1 |
| R | 5 : 4 |
| S | 7 : 6 |
| T | 1 : 4 |
| U | 11 : 10 |
The number of Nokia cellular phones sold by store R is what percent more than that of Samsung cellular phones sold by store P and Q together?
Solution:
| Store | Nokia Cellular Phones | Samsung Cellular Phones | Total Number of Cellular Phones |
| P | 896 | 672 | 1568 |
| Q | 840 | 280 | 1120 |
| R | 1120 | 896 | 2016 |
| S | 1568 | 1344 | 2912 |
| T | 448 | 1792 | 2240 |
| U | 704 | 640 | 1344 |
Number of Nokia phones sold by store R = 1120
Number of Samsung phones sold by store P and Q together
= 672 + 280
= 952
23. Refer to the pie-chart and the table carefully and answer the given question.
Distribution of total number of cellular phones (both Nokia and Samsung) sold by six stores in October.

Ratio of the number of Nokia cellular phones sold to that of Samsung cellular phone sold.
The total number of cellular phones (both Nokia and Samsung) sold by store Q increased by 15% from October to November and the same of cellular phones sold by store T increased by 5% from October to November. What was the total number of cellular phones sold by store Q and T together in November?
Number of cellular phones (both Nokia and Samsung) sold by store Q in October
= 11200 ×
= 1120
∵ Number of cellular phones (both Nokia and Samsung) sold by store Q in November
= 1120 ×
= 1288
Number of cellular phones (both Nokia and Samsung) sold by store T in October
= 11200 ×
= 2240
∵ Number of cellular phones (both Nokia and Samsung) sold by store T in November
= 2240 ×
= 2352
∵ Total number of cellular phones (both Nokia and Samsung) sold by Q and T together in November
= 1288 + 2352
= 3640
Distribution of total number of cellular phones (both Nokia and Samsung) sold by six stores in October.

Ratio of the number of Nokia cellular phones sold to that of Samsung cellular phone sold.
| Store | Ratio |
| P | 4 : 3 |
| Q | 3 : 1 |
| R | 5 : 4 |
| S | 7 : 6 |
| T | 1 : 4 |
| U | 11 : 10 |
The total number of cellular phones (both Nokia and Samsung) sold by store Q increased by 15% from October to November and the same of cellular phones sold by store T increased by 5% from October to November. What was the total number of cellular phones sold by store Q and T together in November?
Solution:
| Store | Nokia Cellular Phones | Samsung Cellular Phones | Total Number of Cellular Phones |
| P | 896 | 672 | 1568 |
| Q | 840 | 280 | 1120 |
| R | 1120 | 896 | 2016 |
| S | 1568 | 1344 | 2912 |
| T | 448 | 1792 | 2240 |
| U | 704 | 640 | 1344 |
Number of cellular phones (both Nokia and Samsung) sold by store Q in October
= 11200 ×
= 1120
∵ Number of cellular phones (both Nokia and Samsung) sold by store Q in November
= 1120 ×
= 1288
Number of cellular phones (both Nokia and Samsung) sold by store T in October
= 11200 ×
= 2240
∵ Number of cellular phones (both Nokia and Samsung) sold by store T in November
= 2240 ×
= 2352
∵ Total number of cellular phones (both Nokia and Samsung) sold by Q and T together in November
= 1288 + 2352
= 3640
24. Refer to the pie-chart and answer the given questions.
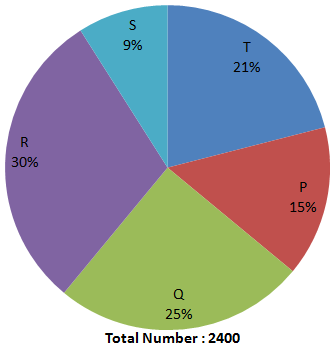
Distribution of total number of Dell Laptops Sold by 5 Stores.

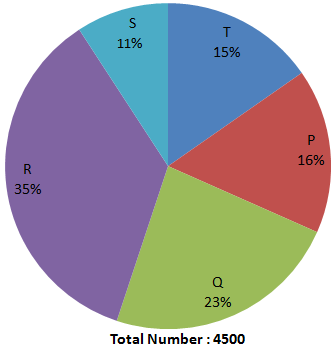
Distribution of number of Laptops (both Dell and Lenovo) Sold by 5 Stores in 2011.

Number of Dell laptops sold by store Q is approximately what percent of the number of the number of laptops (both Dell and Lenovo) sold by store R?
Total number of Dell Laptops bold by store Q
Percent of Laptops Dell and Lenovo sold by store R = 35%
Number of Laptops Dell and Lenovo sold by store R
Distribution of total number of Dell Laptops Sold by 5 Stores.

Distribution of number of Laptops (both Dell and Lenovo) Sold by 5 Stores in 2011.

Number of Dell laptops sold by store Q is approximately what percent of the number of the number of laptops (both Dell and Lenovo) sold by store R?
Solution:
Percent of Dell Laptops sold by store Q = 25%Total number of Dell Laptops bold by store Q
Percent of Laptops Dell and Lenovo sold by store R = 35%
Number of Laptops Dell and Lenovo sold by store R
25. Refer to the pie-chart and answer the given questions.
Distribution of total number of Dell Laptops Sold by 5 Stores.

Distribution of number of Laptops (both Dell and Lenovo) Sold by 5 Stores in 2011.

Number of Dell laptops sold by store T is what percent more than the number of laptops sold by store P?
Number of Laptops sold by store P
Required Percentage
Distribution of total number of Dell Laptops Sold by 5 Stores.

Distribution of number of Laptops (both Dell and Lenovo) Sold by 5 Stores in 2011.

Number of Dell laptops sold by store T is what percent more than the number of laptops sold by store P?
Solution:
Number of Dell laptops sold by store TNumber of Laptops sold by store P
Required Percentage
26. Refer to the pie-chart and answer the given questions.
Distribution of total number of Dell Laptops Sold by 5 Stores.

Distribution of number of Laptops (both Dell and Lenovo) Sold by 5 Stores in 2011.

What is the average number of Dell Laptops sold by stores, P R and S together?
= 15% + 30% + 9%
= 54%
Total Dell Laptops sold by P, R and S together
Distribution of total number of Dell Laptops Sold by 5 Stores.

Distribution of number of Laptops (both Dell and Lenovo) Sold by 5 Stores in 2011.

What is the average number of Dell Laptops sold by stores, P R and S together?
Solution:
Percent of Dell Laptops sold by P, R and S together= 15% + 30% + 9%
= 54%
Total Dell Laptops sold by P, R and S together
27. Refer to the pie-chart and answer the given questions.
Distribution of total number of Dell Laptops Sold by 5 Stores.

Distribution of number of Laptops (both Dell and Lenovo) Sold by 5 Stores in 2011.

What is the difference between number of laptops (both Dell and Lenovo) sold by store Q and total number of Lenovo laptops sold by store R and S together?
Number of Laptops Dell and Lenovo sold by store Q
Percent of Laptops Dell and Lenovo sold by R and S together
= 35% + 11%
= 46%
Now, total number of Laptops Lenovo and Dell sold by R and S together
Percent of Dell Laptops sold by R and S together
= 30% + 9%
= 39%
Number of Dell Laptops sold by R and S together
Number of Lenovo Laptops = 2070 - 936 = 1134
Required difference
= 1134 - 1035
= 99
Distribution of total number of Dell Laptops Sold by 5 Stores.

Distribution of number of Laptops (both Dell and Lenovo) Sold by 5 Stores in 2011.

What is the difference between number of laptops (both Dell and Lenovo) sold by store Q and total number of Lenovo laptops sold by store R and S together?
Solution:
Percent of Laptops Dell and Lenovo sold by store Q = 23%Number of Laptops Dell and Lenovo sold by store Q
Percent of Laptops Dell and Lenovo sold by R and S together
= 35% + 11%
= 46%
Now, total number of Laptops Lenovo and Dell sold by R and S together
Percent of Dell Laptops sold by R and S together
= 30% + 9%
= 39%
Number of Dell Laptops sold by R and S together
Number of Lenovo Laptops = 2070 - 936 = 1134
Required difference
= 1134 - 1035
= 99
28. Refer to the pie-chart and answer the given questions.
Distribution of total number of Dell Laptops Sold by 5 Stores.

Distribution of number of Laptops (both Dell and Lenovo) Sold by 5 Stores in 2011.

What is the central angle corresponding to number of Dell laptops sold by store S?
Central angle corresponding to number of Dell Laptops sold by store S
Distribution of total number of Dell Laptops Sold by 5 Stores.

Distribution of number of Laptops (both Dell and Lenovo) Sold by 5 Stores in 2011.

What is the central angle corresponding to number of Dell laptops sold by store S?
Solution:
Dell laptops sold by store S = 9%Central angle corresponding to number of Dell Laptops sold by store S
29. Study the following pie-chart and the table given below it carefully to answer the questions given below:
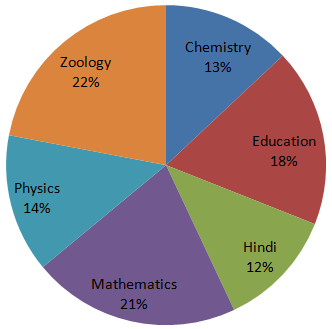
Percentage-wise distribution of lecturers in 6 different subjects in a total number of lecturers: 1600.

Ratio of male to female lecturers
What is the difference between the total number of lecturers (both male and female) is Zoology and the total number of male lecturers in Chemistry and Education Together?
Required difference
= 352 - (26 + 180)
= 352 - 206
= 146
Percentage-wise distribution of lecturers in 6 different subjects in a total number of lecturers: 1600.

Ratio of male to female lecturers
| Lecturers | Males : Females |
| Mathematics | 3 : 4 |
| Education | 5 : 3 |
| Hindi | 1 : 3 |
| Chemistry | 1 : 7 |
| Physics | 9 : 5 |
| Zoology | 7 : 9 |
What is the difference between the total number of lecturers (both male and female) is Zoology and the total number of male lecturers in Chemistry and Education Together?
Solution:
Number of lecturers in various subjects are:| Subject | Number of Males | Number of Females |
| Chemistry | 208 × = 26 | 208 - 26 = 182 |
| Education | 288 × = 180 | 288 - 180 = 108 |
| Hindi | 192 × = 48 | 192 - 48 = 144 |
| Mathematics | 336 × = 144 | 336 - 144 = 192 |
| Physics | 224 × = 144 | 224 - 144 = 80 |
| Zoology | 352 × = 154 | 352 - 154 = 198 |
Required difference
= 352 - (26 + 180)
= 352 - 206
= 146
30. Study the following pie-chart and the table given below it carefully to answer the questions given below:
Percentage-wise distribution of lecturers in 6 different subjects in a total number of lecturers: 1600.

Ratio of male to female lecturers
What is the total number of male lecturers in the university?
Total number of male lecturers in the university
= 26 + 180 + 48 + 144 + 144 + 154
= 696
Percentage-wise distribution of lecturers in 6 different subjects in a total number of lecturers: 1600.

Ratio of male to female lecturers
| Lecturers | Males : Females |
| Mathematics | 3 : 4 |
| Education | 5 : 3 |
| Hindi | 1 : 3 |
| Chemistry | 1 : 7 |
| Physics | 9 : 5 |
| Zoology | 7 : 9 |
What is the total number of male lecturers in the university?
Solution:
Number of lecturers in various subjects are:| Subject | Number of Males | Number of Females |
| Chemistry | 208 × = 26 | 208 - 26 = 182 |
| Education | 288 × = 180 | 288 - 180 = 108 |
| Hindi | 192 × = 48 | 192 - 48 = 144 |
| Mathematics | 336 × = 144 | 336 - 144 = 192 |
| Physics | 224 × = 144 | 224 - 144 = 80 |
| Zoology | 352 × = 154 | 352 - 154 = 198 |
Total number of male lecturers in the university
= 26 + 180 + 48 + 144 + 144 + 154
= 696