Home > Practice > Data Interpretation > Pie Chart > Miscellaneous
31. Study the following pie-chart and the table given below it carefully to answer the questions given below:
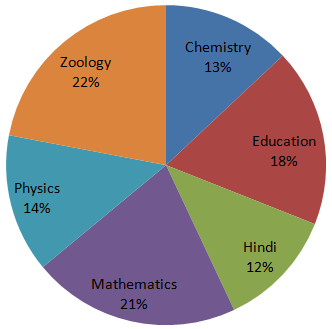
Percentage-wise distribution of lecturers in 6 different subjects in a total number of lecturers: 1600.

Ratio of male to female lecturers
Total number of lecturers (both male and female) in Hindi is approximately what percent of the total number of female lecturers in Mathematics and chemistry together?
Percentage-wise distribution of lecturers in 6 different subjects in a total number of lecturers: 1600.

Ratio of male to female lecturers
| Lecturers | Males : Females |
| Mathematics | 3 : 4 |
| Education | 5 : 3 |
| Hindi | 1 : 3 |
| Chemistry | 1 : 7 |
| Physics | 9 : 5 |
| Zoology | 7 : 9 |
Total number of lecturers (both male and female) in Hindi is approximately what percent of the total number of female lecturers in Mathematics and chemistry together?
Solution:
Number of lecturers in various subjects are:| Subject | Number of Males | Number of Females |
| Chemistry | 208 × = 26 | 208 - 26 = 182 |
| Education | 288 × = 180 | 288 - 180 = 108 |
| Hindi | 192 × = 48 | 192 - 48 = 144 |
| Mathematics | 336 × = 144 | 336 - 144 = 192 |
| Physics | 224 × = 144 | 224 - 144 = 80 |
| Zoology | 352 × = 154 | 352 - 154 = 198 |
32. Study the following pie-chart and the table given below it carefully to answer the questions given below:
Percentage-wise distribution of lecturers in 6 different subjects in a total number of lecturers: 1600.

Ratio of male to female lecturers
What is the difference between the number of female lecturers in Zoology and the number of male lecturers in Hindi?
Required difference
= 198 - 48
= 150
Percentage-wise distribution of lecturers in 6 different subjects in a total number of lecturers: 1600.

Ratio of male to female lecturers
| Lecturers | Males : Females |
| Mathematics | 3 : 4 |
| Education | 5 : 3 |
| Hindi | 1 : 3 |
| Chemistry | 1 : 7 |
| Physics | 9 : 5 |
| Zoology | 7 : 9 |
What is the difference between the number of female lecturers in Zoology and the number of male lecturers in Hindi?
Solution:
Number of lecturers in various subjects are:| Subject | Number of Males | Number of Females |
| Chemistry | 208 × = 26 | 208 - 26 = 182 |
| Education | 288 × = 180 | 288 - 180 = 108 |
| Hindi | 192 × = 48 | 192 - 48 = 144 |
| Mathematics | 336 × = 144 | 336 - 144 = 192 |
| Physics | 224 × = 144 | 224 - 144 = 80 |
| Zoology | 352 × = 154 | 352 - 154 = 198 |
Required difference
= 198 - 48
= 150
33. Study the following pie-chart and the table given below it carefully to answer the questions given below:
Percentage-wise distribution of lecturers in 6 different subjects in a total number of lecturers: 1600.

Ratio of male to female lecturers
What is the ratio of the number of female lecturers in Physics to the number of male lecturers in Mathematics?
Required ratio
= 80 : 144
= 5 : 9
Percentage-wise distribution of lecturers in 6 different subjects in a total number of lecturers: 1600.

Ratio of male to female lecturers
| Lecturers | Males : Females |
| Mathematics | 3 : 4 |
| Education | 5 : 3 |
| Hindi | 1 : 3 |
| Chemistry | 1 : 7 |
| Physics | 9 : 5 |
| Zoology | 7 : 9 |
What is the ratio of the number of female lecturers in Physics to the number of male lecturers in Mathematics?
Solution:
Number of lecturers in various subjects are:| Subject | Number of Males | Number of Females |
| Chemistry | 208 × = 26 | 208 - 26 = 182 |
| Education | 288 × = 180 | 288 - 180 = 108 |
| Hindi | 192 × = 48 | 192 - 48 = 144 |
| Mathematics | 336 × = 144 | 336 - 144 = 192 |
| Physics | 224 × = 144 | 224 - 144 = 80 |
| Zoology | 352 × = 154 | 352 - 154 = 198 |
Required ratio
= 80 : 144
= 5 : 9
34. Study the following pie-chart carefully and answer the questions given below:
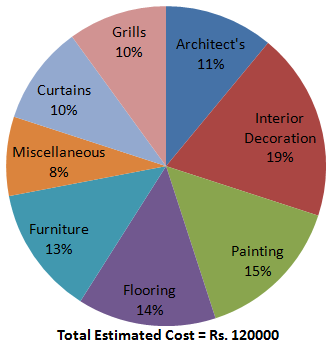
Cost Estimated by a Family in Renovation of their House.

What is the cost estimated by the family on painting and flooring together?
Cost Estimated by a Family in Renovation of their House.

What is the cost estimated by the family on painting and flooring together?
Solution:
Cost estimated on painting and flooring together
35. Study the following pie-chart carefully and answer the questions given below:
Cost Estimated by a Family in Renovation of their House.

What is the difference in the amount estimated by the family on interior decoration and that on architect’s fee?
Cost Estimated by a Family in Renovation of their House.

What is the difference in the amount estimated by the family on interior decoration and that on architect’s fee?
Solution:
36. Study the following pie-chart carefully and answer the questions given below:
Cost Estimated by a Family in Renovation of their House.

The family gets a discount on furniture and pays 12% less than the estimated cost on furniture. What is the amount spent on furniture?
Cost Estimated by a Family in Renovation of their House.

The family gets a discount on furniture and pays 12% less than the estimated cost on furniture. What is the amount spent on furniture?
Solution:
37. Study the following pie-chart carefully and answer the questions given below:
Cost Estimated by a Family in Renovation of their House.

Other than getting the discount of 12% on the estimated cost of furniture and actual miscellaneous expenditure being Rs. 10200 instead of the estimated one, the family's estimated cost is correct. What is the total amount spent by the family in renovating its house?
Actual cost of furniture and miscellaneous expenditure
= Rs. (13728 + 10200)
= Rs. 23928
Total amount spent in renovating the house
= Rs. (120000 - 25200 + 23928)
= Rs. 118728
Cost Estimated by a Family in Renovation of their House.

Other than getting the discount of 12% on the estimated cost of furniture and actual miscellaneous expenditure being Rs. 10200 instead of the estimated one, the family's estimated cost is correct. What is the total amount spent by the family in renovating its house?
Solution:
Estimated cost of furniture and miscellaneous expenditureActual cost of furniture and miscellaneous expenditure
= Rs. (13728 + 10200)
= Rs. 23928
Total amount spent in renovating the house
= Rs. (120000 - 25200 + 23928)
= Rs. 118728
38. Study the following pie-chart and table carefully and answer the questions given below:
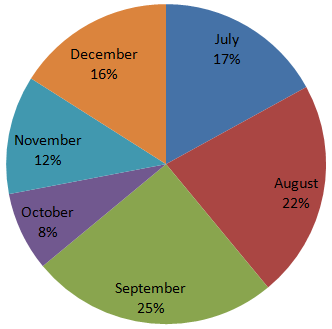
Percentage-wise Distribution of the Number of Mobile phones Sold by a Shopkeeper During Six Months. Ratio of mobile phones sold of Company A & Company B.

If the shopkeeper earned a profit of Rs. 433 on each mobile phone sold of company B during October, what was his total profit earned on the mobile phones of that company during the same month?
Percentage-wise Distribution of the Number of Mobile phones Sold by a Shopkeeper During Six Months. Ratio of mobile phones sold of Company A & Company B.

| Total number if mobile phones sold = 45000 | |
| Month | Ratio (A : B) |
| July | 8 : 7 |
| August | 4 : 5 |
| September | 3 : 2 |
| October | 7 : 5 |
| November | 7 : 8 |
| December | 7 : 9 |
If the shopkeeper earned a profit of Rs. 433 on each mobile phone sold of company B during October, what was his total profit earned on the mobile phones of that company during the same month?
Solution:
Number of mobile phones sold by B during October
39. Study the following pie-chart and table carefully and answer the questions given below:
Percentage-wise Distribution of the Number of Mobile phones Sold by a Shopkeeper During Six Months. Ratio of mobile phones sold of Company A & Company B.

What is the ratio of the number of mobile phones sold of company B during July to those sold during December of the same company?
Number of mobile phones sold by B during December
Percentage-wise Distribution of the Number of Mobile phones Sold by a Shopkeeper During Six Months. Ratio of mobile phones sold of Company A & Company B.

| Total number if mobile phones sold = 45000 | |
| Month | Ratio (A : B) |
| July | 8 : 7 |
| August | 4 : 5 |
| September | 3 : 2 |
| October | 7 : 5 |
| November | 7 : 8 |
| December | 7 : 9 |
What is the ratio of the number of mobile phones sold of company B during July to those sold during December of the same company?
Solution:
Number of mobile phones sold by B during JulyNumber of mobile phones sold by B during December
40. Study the following pie-chart and table carefully and answer the questions given below:
Percentage-wise Distribution of the Number of Mobile phones Sold by a Shopkeeper During Six Months. Ratio of mobile phones sold of Company A & Company B.

The number of mobile phones sold of Company A during July is approximately what percent of the number of mobile phones sold of company A during December?
Number of mobile phones sold by A during December
Percentage-wise Distribution of the Number of Mobile phones Sold by a Shopkeeper During Six Months. Ratio of mobile phones sold of Company A & Company B.

| Total number if mobile phones sold = 45000 | |
| Month | Ratio (A : B) |
| July | 8 : 7 |
| August | 4 : 5 |
| September | 3 : 2 |
| October | 7 : 5 |
| November | 7 : 8 |
| December | 7 : 9 |
The number of mobile phones sold of Company A during July is approximately what percent of the number of mobile phones sold of company A during December?
Solution:
Number of mobile phones sold by A during JulyNumber of mobile phones sold by A during December