Home > Practice > Data Interpretation > Bar Graphs > Miscellaneous
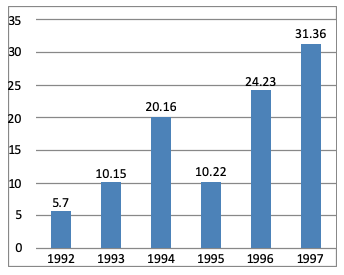
131. Study the bar diagram carefully and answer the questions. The bar diagram shows the trends of foreign direct investment (FDI) into India from all over the World (in Rs. crores).

The difference between FDI of 1997 and 1996.
= 31.36 - 24.23
= 7.13

The difference between FDI of 1997 and 1996.
Solution:
Absolute difference in FDI to India between 1996 and 1997= 31.36 - 24.23
= 7.13
132. Study the bar diagram carefully and answer the questions. The bar diagram shows the trends of foreign direct investment (FDI) into India from all over the World (in Rs. crores).

The sum of FDI of 1992 and 1993 is.
= 5.7 + 10.15
= 15.85 cr

The sum of FDI of 1992 and 1993 is.
Solution:
Sum of FDI of 1992 and 1993= 5.7 + 10.15
= 15.85 cr
133. Study the bar diagram carefully and answer the questions. The bar diagram shows the trends of foreign direct investment (FDI) into India from all over the World (in Rs. crores).

The ratio of investment in 1997 to the average investment is:
=
=
= 16.97
Then ratio of average investment to year 1997

The ratio of investment in 1997 to the average investment is:
Solution:
Average investment=
=
= 16.97
Then ratio of average investment to year 1997
134. Study the bar diagram carefully and answer the questions. The bar diagram shows the trends of foreign direct investment (FDI) into India from all over the World (in Rs. crores).

The year which exhibited the 2nd highest growth percentage in FDI in India over the period shown is:

The year which exhibited the 2nd highest growth percentage in FDI in India over the period shown is:
Solution:
2nd highest FDI year is 1996. In which FDI is 24.23
135. Study the bar diagram and answer the following questions.

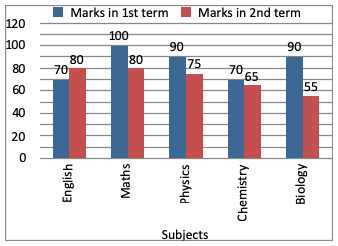
The ratio of the average of the marks obtained in Biology for two terms to the average of the marks obtained in English and Mathematics for first term only is:
Average of sum of Math first term & English first term

The ratio of the average of the marks obtained in Biology for two terms to the average of the marks obtained in English and Mathematics for first term only is:
Solution:
Average of sum of Math first term & English first term
136. Study the bar diagram and answer the following questions.

Average marks obtained in physics for two terms is-

Average marks obtained in physics for two terms is-
Solution:
Average marks obtained in two terms
137. Study the bar diagram and answer the following questions.

What is the percentage of marks obtained in chemistry for both the terms?

What is the percentage of marks obtained in chemistry for both the terms?
Solution:
Percentage of marks in chemistry of both term
138. Study the bar diagram and answer the following questions.

Difference of marks obtained in both the terms by the students is maximum in:

Difference of marks obtained in both the terms by the students is maximum in:
Solution:
From graph it is clear that maximum difference of marks in both term is for biology.
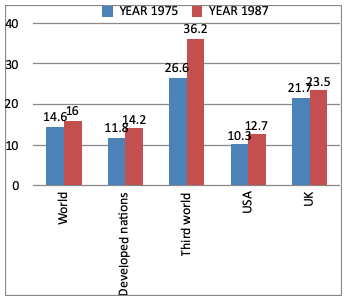
139. Study the following bar graph and answer the questions. The Bar graph gives the annual rates of inflation in percentage for 1975 and 1987.

Comparing the figures for USA vis-a-vis the developed nations, it can be concluded that.

Comparing the figures for USA vis-a-vis the developed nations, it can be concluded that.
Solution:
From graph it is clear that USA had better central on inflation.
140. Study the following bar graph and answer the questions. The Bar graph gives the annual rates of inflation in percentage for 1975 and 1987.

From 1975 to 1987, inflation rate increased in the third world countries approximately by:

From 1975 to 1987, inflation rate increased in the third world countries approximately by:
Solution: