Home > Practice > Data Interpretation > Bar Graphs > Miscellaneous
111. Study the bar chart & answer the questions.
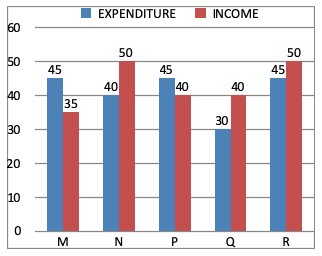
Income and Expenditure (in crore Rs.) in 2001 of five companies.

For company R, if the expenditure had increased by 20% in the year 2001 from the year 2000 and company had earned profit of 10% in 2000, the company’s income in year 2000 (in crore).
Expenditure in 2000 of R
The income of company in 2000
Income and Expenditure (in crore Rs.) in 2001 of five companies.

For company R, if the expenditure had increased by 20% in the year 2001 from the year 2000 and company had earned profit of 10% in 2000, the company’s income in year 2000 (in crore).
Solution:
Expenditure in 2001 of R = 45Expenditure in 2000 of R
The income of company in 2000
112. Study the bar chart & answer the questions.
Income and Expenditure (in crore Rs.) in 2001 of five companies.

The company earning the percentage of profit in the year 2001 is:
= 2001 in Q
= × 100
= 25%
Income and Expenditure (in crore Rs.) in 2001 of five companies.

The company earning the percentage of profit in the year 2001 is:
Solution:
Maximum percentage of profit in the year= 2001 in Q
= × 100
= 25%
113. Study the bar chart & answer the questions.
Income and Expenditure (in crore Rs.) in 2001 of five companies.

In 2001, the approximate percentage of profit/loss of all the five companies taken together is equal to:
= 35 + 50 + 40 + 40 + 50
= 215
Total expenditure of all are
= 45 + 40 + 45 + 30 + 45
= 205
Saving = 215 - 205 = 10
Profit% = × 100
= 4.65% profit
Income and Expenditure (in crore Rs.) in 2001 of five companies.

In 2001, the approximate percentage of profit/loss of all the five companies taken together is equal to:
Solution:
Total income of all are= 35 + 50 + 40 + 40 + 50
= 215
Total expenditure of all are
= 45 + 40 + 45 + 30 + 45
= 205
Saving = 215 - 205 = 10
Profit% = × 100
= 4.65% profit
114. Study the bar chart & answer the questions.
Income and Expenditure (in crore Rs.) in 2001 of five companies.

The companies M and N together had a percentage of profit/loss of:
Expenditure of M & N is = 45 + 40 = 85
∴ No loss and no profit
Income and Expenditure (in crore Rs.) in 2001 of five companies.

The companies M and N together had a percentage of profit/loss of:
Solution:
Income of M & N is = 35 + 50 = 85Expenditure of M & N is = 45 + 40 = 85
∴ No loss and no profit
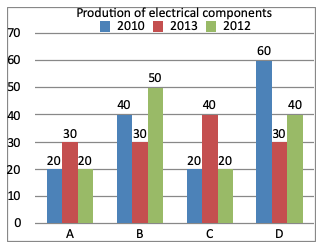
115. Study the following graph carefully and answer the given questions.

What is the ratio between average production by company B in three years to the average production by company C in three years?

What is the ratio between average production by company B in three years to the average production by company C in three years?
Solution:
116. Study the following graph carefully and answer the given questions.

Which company has the highest average production over the three years?
So company D has the highest production.

Which company has the highest average production over the three years?
Solution:
So company D has the highest production.
117. Study the following graph carefully and answer the given questions.

Which the drop in production of company D from year 2010 to 2012 in percentage?

Which the drop in production of company D from year 2010 to 2012 in percentage?
Solution:
118. Study the following graph carefully and answer the given questions.

The total production of companies A and D in year 2010 is what percent of total production of four companies in the year 2012?
= 20 + 60
= 80
In 2012, A + B + C + D
= 20 + 50 + 20 + 40
= 130
= × 100
≈ 61%

The total production of companies A and D in year 2010 is what percent of total production of four companies in the year 2012?
Solution:
In 2010, A and D= 20 + 60
= 80
In 2012, A + B + C + D
= 20 + 50 + 20 + 40
= 130
= × 100
≈ 61%
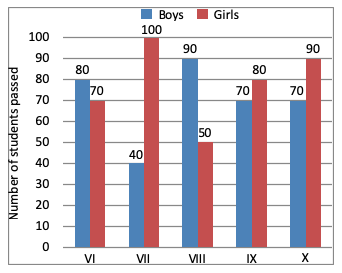
119. The bar graph shows the results of an annual examination in a secondary school in a certain year. Answer the following four questions based on this chart.

The ratio of the total number of boys passed to the total number of girls passed in the three classes VII, VIII and IX is:

The ratio of the total number of boys passed to the total number of girls passed in the three classes VII, VIII and IX is:
Solution:
120. The bar graph shows the results of an annual examination in a secondary school in a certain year. Answer the following four questions based on this chart.

The average number of boys passed per class per class is:
= 80 + 40 + 90 + 70 + 70
= 350
∴ Average = = 70

The average number of boys passed per class per class is:
Solution:
Total numbers of boys= 80 + 40 + 90 + 70 + 70
= 350
∴ Average = = 70