Home > Practice > Data Interpretation > Bar Graphs > Miscellaneous
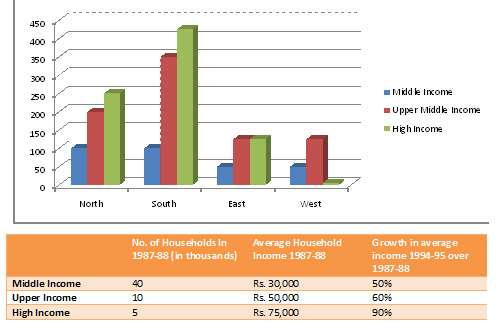
21. The following bar chart gives the growth percentage in the number of households in middle, upper-middle and high-income categories in the four regions for the period between 1987-88 and 1994-95.

Which region showed the highest growth in number of households in all the income categories for the period ?

Which region showed the highest growth in number of households in all the income categories for the period ?
Solution:
From graph it is clear that southern region showed the highest growth in number of households in all the income categories for the period.
22. The following bar chart gives the growth percentage in the number of households in middle, upper-middle and high-income categories in the four regions for the period between 1987-88 and 1994-95.

What was the total household income in northern region for upper-middle class ?

What was the total household income in northern region for upper-middle class ?
Solution:
Region wise breakup is not available. hence, question cannot be answered.
23. The following bar chart gives the growth percentage in the number of households in middle, upper-middle and high-income categories in the four regions for the period between 1987-88 and 1994-95.

What is the percentage increase in total number of households for the northern region (upper-middle) over the given period ?

What is the percentage increase in total number of households for the northern region (upper-middle) over the given period ?
Solution:
The percentage increase in total number of households for the northern region for upper-middle income category is 200%.
24. The following bar chart gives the growth percentage in the number of households in middle, upper-middle and high-income categories in the four regions for the period between 1987-88 and 1994-95.

What was the average income of the high-income group in 1987-88?

What was the average income of the high-income group in 1987-88?
Solution:
It is clear from the table average income is Rs. 75,000.
25. study the following pie chart and bar diagram and answer the following questions.
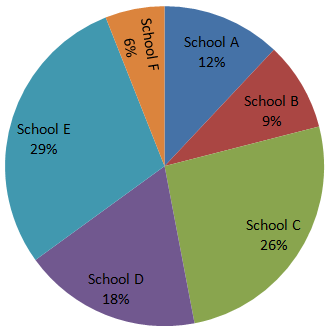
Percentage-wise Distribution of students in 6 Different Schools. Total number of students = 6000.

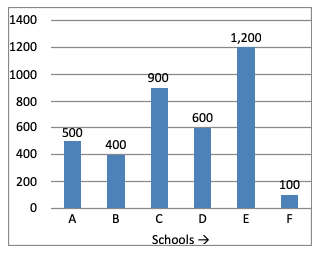
Number of Boys in Each School Out of 6000 Student

What is the ratio of the number of boys in school C, the number of girls in school B and the total number of students in school E?
Number of boys in:
A → 500
B → 400
C → 900
D → 600
E → 1200
F → 100
Number of girls in:
A → 720 - 500 = 220
B → 540 - 400 = 140
C → 1560 - 900 = 660
D → 1080 - 600 = 480
E → 1740 - 1200 = 540
F → 360 - 100 = 260
Required ratio
= 900 : 140 : 1740
= 90 : 14 : 174
= 45 : 7 : 87
Percentage-wise Distribution of students in 6 Different Schools. Total number of students = 6000.

Number of Boys in Each School Out of 6000 Student

What is the ratio of the number of boys in school C, the number of girls in school B and the total number of students in school E?
Solution:
Number of boys in:
A → 500
B → 400
C → 900
D → 600
E → 1200
F → 100
Number of girls in:
A → 720 - 500 = 220
B → 540 - 400 = 140
C → 1560 - 900 = 660
D → 1080 - 600 = 480
E → 1740 - 1200 = 540
F → 360 - 100 = 260
Required ratio
= 900 : 140 : 1740
= 90 : 14 : 174
= 45 : 7 : 87
26. study the following pie chart and bar diagram and answer the following questions.
Percentage-wise Distribution of students in 6 Different Schools. Total number of students = 6000.

Number of Boys in Each School Out of 6000 Student

The number of girls school A is approximately what percentage of the total number of students in school B?
Number of boys in:
A → 500
B → 400
C → 900
D → 600
E → 1200
F → 100
Number of girls in:
A → 720 - 500 = 220
B → 540 - 400 = 140
C → 1560 - 900 = 660
D → 1080 - 600 = 480
E → 1740 - 1200 = 540
F → 360 - 100 = 260
Let (number of girls in A) be % of number of students in B.
Then,
Percentage-wise Distribution of students in 6 Different Schools. Total number of students = 6000.

Number of Boys in Each School Out of 6000 Student

The number of girls school A is approximately what percentage of the total number of students in school B?
Solution:
Number of boys in:
A → 500
B → 400
C → 900
D → 600
E → 1200
F → 100
Number of girls in:
A → 720 - 500 = 220
B → 540 - 400 = 140
C → 1560 - 900 = 660
D → 1080 - 600 = 480
E → 1740 - 1200 = 540
F → 360 - 100 = 260
Let (number of girls in A) be % of number of students in B.
Then,
27. study the following pie chart and bar diagram and answer the following questions.
Percentage-wise Distribution of students in 6 Different Schools. Total number of students = 6000.

Number of Boys in Each School Out of 6000 Student

What is the sum of the number of girls in school C, the number of girls in school E and the number of boys in school D together?
Number of boys in:
A → 500
B → 400
C → 900
D → 600
E → 1200
F → 100
Number of girls in:
A → 720 - 500 = 220
B → 540 - 400 = 140
C → 1560 - 900 = 660
D → 1080 - 600 = 480
E → 1740 - 1200 = 540
F → 360 - 100 = 260
Required sum
= 660 + 540 + 600
= 1800
Percentage-wise Distribution of students in 6 Different Schools. Total number of students = 6000.

Number of Boys in Each School Out of 6000 Student

What is the sum of the number of girls in school C, the number of girls in school E and the number of boys in school D together?
Solution:
Number of boys in:
A → 500
B → 400
C → 900
D → 600
E → 1200
F → 100
Number of girls in:
A → 720 - 500 = 220
B → 540 - 400 = 140
C → 1560 - 900 = 660
D → 1080 - 600 = 480
E → 1740 - 1200 = 540
F → 360 - 100 = 260
Required sum
= 660 + 540 + 600
= 1800
28. study the following pie chart and bar diagram and answer the following questions.
Percentage-wise Distribution of students in 6 Different Schools. Total number of students = 6000.

Number of Boys in Each School Out of 6000 Student

What is the difference between the total number of students in school F and the number of boys in school E?
Number of boys in:
A → 500
B → 400
C → 900
D → 600
E → 1200
F → 100
Number of girls in:
A → 720 - 500 = 220
B → 540 - 400 = 140
C → 1560 - 900 = 660
D → 1080 - 600 = 480
E → 1740 - 1200 = 540
F → 360 - 100 = 260
(Number of boys in E) - (Number of students in F)
= 1200 - 360
= 840
Percentage-wise Distribution of students in 6 Different Schools. Total number of students = 6000.

Number of Boys in Each School Out of 6000 Student

What is the difference between the total number of students in school F and the number of boys in school E?
Solution:
Number of boys in:
A → 500
B → 400
C → 900
D → 600
E → 1200
F → 100
Number of girls in:
A → 720 - 500 = 220
B → 540 - 400 = 140
C → 1560 - 900 = 660
D → 1080 - 600 = 480
E → 1740 - 1200 = 540
F → 360 - 100 = 260
(Number of boys in E) - (Number of students in F)
= 1200 - 360
= 840
29. study the following pie chart and bar diagram and answer the following questions.
Percentage-wise Distribution of students in 6 Different Schools. Total number of students = 6000.

Number of Boys in Each School Out of 6000 Student

In which of the following schools is the total number of students equal to the number of girls in school E?
Number of boys in:
A → 500
B → 400
C → 900
D → 600
E → 1200
F → 100
Number of girls in:
A → 720 - 500 = 220
B → 540 - 400 = 140
C → 1560 - 900 = 660
D → 1080 - 600 = 480
E → 1740 - 1200 = 540
F → 360 - 100 = 260
Number of girls in School E = 540
= Total number of students in B
Percentage-wise Distribution of students in 6 Different Schools. Total number of students = 6000.

Number of Boys in Each School Out of 6000 Student

In which of the following schools is the total number of students equal to the number of girls in school E?
Solution:
Number of boys in:
A → 500
B → 400
C → 900
D → 600
E → 1200
F → 100
Number of girls in:
A → 720 - 500 = 220
B → 540 - 400 = 140
C → 1560 - 900 = 660
D → 1080 - 600 = 480
E → 1740 - 1200 = 540
F → 360 - 100 = 260
Number of girls in School E = 540
= Total number of students in B
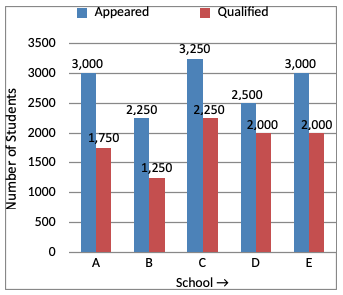
30. Study the following graph carefully and answer the questions given below:
Total Number of Students Appeared and Qualified from Various Schools at a Scholarship Exam.

What is the ratio of the number of students appeared to the number of students qualified at the scholarship exam from School C?
Total Number of Students Appeared and Qualified from Various Schools at a Scholarship Exam.

What is the ratio of the number of students appeared to the number of students qualified at the scholarship exam from School C?
Solution:
(Number of students appeared from C) : (Number of students qualified from C)