Home > Practice > Data Interpretation > Bar Graphs > Miscellaneous
51. Study the following graph carefully to answer the questions that follow:
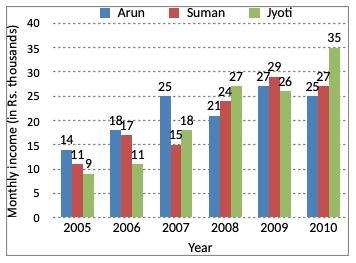
Monthly income (Rs. in thousands) of three different persons in six different years

In which year was the difference between Jyoti’s monthly income and Arun’s monthly income second highest ?
In 2006 difference between Jyoti's monthly income and Arun's monthly income second highest.
Monthly income (Rs. in thousands) of three different persons in six different years

In which year was the difference between Jyoti’s monthly income and Arun’s monthly income second highest ?
Solution:
| Year | Arun's income | Jyoti's income | Difference |
| 2005 | 14000 | 9000 | 5000 |
| 2006 | 18000 | 11000 | 7000 |
| 2007 | 23000 | 18000 | 5000 |
| 2008 | 21000 | 27000 | 6000 |
| 2009 | 27000 | 26000 | 1000 |
| 2010 | 25000 | 35000 | 10000 |
In 2006 difference between Jyoti's monthly income and Arun's monthly income second highest.
52. Study the following graph carefully to answer the questions that follow:
Monthly income (Rs. in thousands) of three different persons in six different years

What was the percentage increase in the monthly income of Jyoti in the year 2008 as compared to previous year ?
Jyoti's income in 2007 = Rs. 18000
∴ Increase percentage
Monthly income (Rs. in thousands) of three different persons in six different years

What was the percentage increase in the monthly income of Jyoti in the year 2008 as compared to previous year ?
Solution:
Jyoti's income in 2008 = Rs. 27000Jyoti's income in 2007 = Rs. 18000
∴ Increase percentage
53. Study the following graph carefully to answer the questions that follow:
Monthly income (Rs. in thousands) of three different persons in six different years

What is the respective ratio between Arun’s monthly income in the year 2006, Suman’s monthly income in the year 2007 and Jyoti’s monthly income in the year 2005?
Monthly income (Rs. in thousands) of three different persons in six different years

What is the respective ratio between Arun’s monthly income in the year 2006, Suman’s monthly income in the year 2007 and Jyoti’s monthly income in the year 2005?
Solution:
| In year 2006 Arun's salary | In year 2007 Suman's salary | In year 2005 Jyoti's salary |
| 18000 | 15000 | 9000 |
| 18 | 15 | 9 |
| 6 | 5 | 3 |
54. Study the following graph carefully to answer the questions that follow:
Monthly income (Rs. in thousands) of three different persons in six different years

Monthly income of Suman in the year 2009 was approximately what percentage of the monthly income of Jyoti in the year 2010 ?
Monthly income of Jyoti in year 2010 = Rs. 35000
Monthly income (Rs. in thousands) of three different persons in six different years

Monthly income of Suman in the year 2009 was approximately what percentage of the monthly income of Jyoti in the year 2010 ?
Solution:
Monthly income of Suman in year 2009 = Rs. 29000Monthly income of Jyoti in year 2010 = Rs. 35000
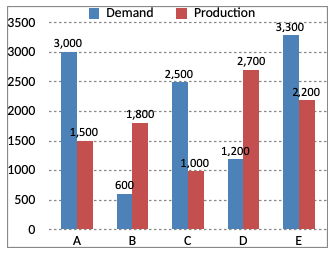
55. The following chart represents Demand and Production for 5 companies ABCDE. On the basis of the graph answer the questions.

If the production of company D is h times of the production of company A. Then h equals:
Production of company A = 1500

If the production of company D is h times of the production of company A. Then h equals:
Solution:
Production of company D = 2700Production of company A = 1500
56. The following chart represents Demand and Production for 5 companies ABCDE. On the basis of the graph answer the questions.

The ratio of the number of companies having more demand to those having more production than demand is -
Number of companies having more production than demand = 2
∴ Required ratio
= 3 : 2

The ratio of the number of companies having more demand to those having more production than demand is -
Solution:
Number of companies having more demand than production = 3Number of companies having more production than demand = 2
∴ Required ratio
= 3 : 2
57. The following chart represents Demand and Production for 5 companies ABCDE. On the basis of the graph answer the questions.

If company A desires to meet the demand by purchasing surplus production of company, then the most suitable company is -
= 3000 - 1500
= 1500
Difference between production and demand of company D
= 2700 - 1200
= 1500

If company A desires to meet the demand by purchasing surplus production of company, then the most suitable company is -
Solution:
Difference between demand and production of company A= 3000 - 1500
= 1500
Difference between production and demand of company D
= 2700 - 1200
= 1500
58. The following chart represents Demand and Production for 5 companies ABCDE. On the basis of the graph answer the questions.

The difference between average demand and average production of the five companies taken together is-
= 1500 + 1800 +1000 + 2700 + 2200
= 9200
Total demand of the five companies
= 3000 + 600 + 2500 + 1200 + 3300
= 10600
∴ Required difference

The difference between average demand and average production of the five companies taken together is-
Solution:
Total production of the five companies= 1500 + 1800 +1000 + 2700 + 2200
= 9200
Total demand of the five companies
= 3000 + 600 + 2500 + 1200 + 3300
= 10600
∴ Required difference
59. The following chart represents Demand and Production for 5 companies ABCDE. On the basis of the graph answer the questions.

If x% of demand for company C equals demand for company B, then x equals.

If x% of demand for company C equals demand for company B, then x equals.
Solution:
Given % of demand for company C = Demand for company B
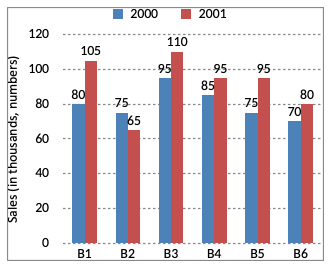
60. The bar graph given below shows the sales of books (in thousand numbers from six branches of a publishing company during two consecutive years 2000 and 2001. Sales of books (in thousands numbers) from six branches B1, B2, B3, B4, B5 and B6 of a publishing company in 2000 and 2001.

Total sales of branch B6 for both the years is what percent of the total sales of branch B3 for both the years?
= 70 + 80
= 150
Total sales of branch B3 for both years
= 95 + 110
= 205
∴ Required percentage
=
= 73.17%

Total sales of branch B6 for both the years is what percent of the total sales of branch B3 for both the years?
Solution:
Total sales of branch B6 for both years= 70 + 80
= 150
Total sales of branch B3 for both years
= 95 + 110
= 205
∴ Required percentage
=
= 73.17%