Home > Practice > Data Interpretation > Bar Graphs > Miscellaneous
101. Study the bar diagram and answer the following questions.
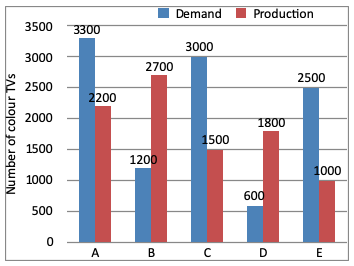
Demand and production of colour TV of five companies A, B, C, D, and E.

The ratio of average demand to average production of companies B and D is:
= 900 : 2250
= 2 : 5
Demand and production of colour TV of five companies A, B, C, D, and E.

The ratio of average demand to average production of companies B and D is:
Solution:
Required ratio= 900 : 2250
= 2 : 5
102. Study the bar diagram and answer the following questions.
Demand and production of colour TV of five companies A, B, C, D, and E.

The ratio of the number of companies having more demand than production to the companies having more production than demand is:
Companies having more production than demand (B and D) = 2
∴ Required ration = 3 : 2
Demand and production of colour TV of five companies A, B, C, D, and E.

The ratio of the number of companies having more demand than production to the companies having more production than demand is:
Solution:
Companies having more demand than production are A, C, E = 3Companies having more production than demand (B and D) = 2
∴ Required ration = 3 : 2
103. Study the bar diagram and answer the following questions.
Demand and production of colour TV of five companies A, B, C, D, and E.

The percentage of the demand of company D as compared to the demand of company E is:
Demand and production of colour TV of five companies A, B, C, D, and E.

The percentage of the demand of company D as compared to the demand of company E is:
Solution:
104. Study the graph and answer the questions.

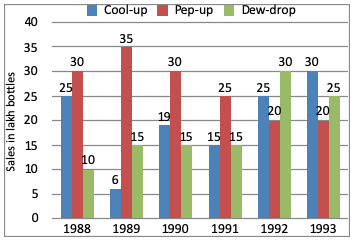
What was the approximate percent drop in the sales of pep-up in 1990 over its sale in 1989?
Year 1989 = 35 lakh bottles
Year 1990 = 30 lakh bottles
∴ Required percent

What was the approximate percent drop in the sales of pep-up in 1990 over its sale in 1989?
Solution:
Sales of pep up:Year 1989 = 35 lakh bottles
Year 1990 = 30 lakh bottles
∴ Required percent
105. Study the graph and answer the questions.

In case of which soft drink was the average annual sale minimum during the period 1988-1993?

In case of which soft drink was the average annual sale minimum during the period 1988-1993?
Solution:
106. Study the graph and answer the questions.

In which year the sale of cool-up is minimum?
Minimum sales is in 1989 = 55 lakh bottles

In which year the sale of cool-up is minimum?
Solution:
It is clear from the graphMinimum sales is in 1989 = 55 lakh bottles
107. Study the graph and answer the questions.

What was the approximate percent increase in sales of cool-up in 1990 over its sales in 1989?
Sales of cool up in 1990 = 19 lakh bottles
∴ Required percent

What was the approximate percent increase in sales of cool-up in 1990 over its sales in 1989?
Solution:
Sales of cool up in 1989 = 6 lakh bottlesSales of cool up in 1990 = 19 lakh bottles
∴ Required percent
108. Study the graph and answer the questions.

In case of which soft drink was the average annual sale maximum during the period 1988-1993?
Cool up

In case of which soft drink was the average annual sale maximum during the period 1988-1993?
Solution:
Average annual sales during 1988 - 1993Cool up
109. Study the graph and answer the questions.

In which year sale of Dew-drop is maximum?

In which year sale of Dew-drop is maximum?
Solution:
Sales of dew drop in 1992 = 30 lakh bottles
110. Study the bar chart & answer the questions.
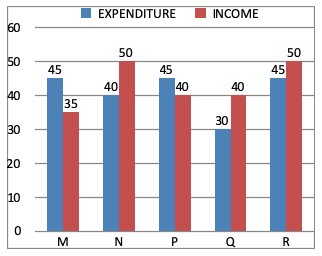
Income and Expenditure (in crore Rs.) in 2001 of five companies.

In the income of company Q in 2001 was 10% more than 2000 and the company had earned a profit of 20% in 2000, then its expenditure in 2000 (in crores) was:
Income of company Q in 2000 = 40 × = 36.36
Profit in 2000 = 36.36 × = 7.27
∴ Expenditure in 2000
= 36.36 - 7.27
= 29.09
Income and Expenditure (in crore Rs.) in 2001 of five companies.

In the income of company Q in 2001 was 10% more than 2000 and the company had earned a profit of 20% in 2000, then its expenditure in 2000 (in crores) was:
Solution:
Income of company Q in 2001 = 40Income of company Q in 2000 = 40 × = 36.36
Profit in 2000 = 36.36 × = 7.27
∴ Expenditure in 2000
= 36.36 - 7.27
= 29.09