Home > Practice > Data Interpretation > Bar Graphs > Miscellaneous
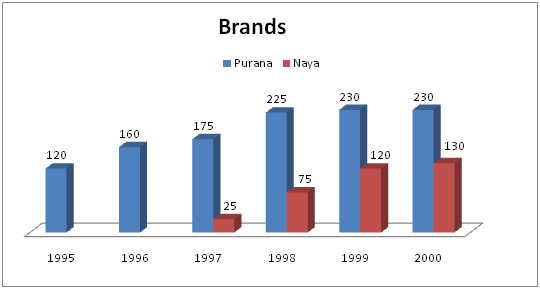
11. : Purana and Naya two brand of mixer-grinder available in the market. Purana was introduced in 1990 and Naya was introduced in 1997. For both brands, 20% of the mixer-grinder bought in a particular year are disposed off as junk exactly two year later. It is known that 10 Purana mixer-grinder were disposed off in 1997. The following chart show the operation from 1995 to 2000, as at end of the year.

How many Naya mixer-grinders were purchased in 1999?
There for in 1999, 5 mixer-grinder disposed off (20% of 25).
Also the number of mixer grinder in circulation in 1999 was 120 and 1998 was 75. The difference is 45.
The total number of mixer-grinder purchased is (45 + 5) = 50

How many Naya mixer-grinders were purchased in 1999?
Solution:
It is given that 20% of the mixer-grinders are disposed off after 2 years.There for in 1999, 5 mixer-grinder disposed off (20% of 25).
Also the number of mixer grinder in circulation in 1999 was 120 and 1998 was 75. The difference is 45.
The total number of mixer-grinder purchased is (45 + 5) = 50
12. : Purana and Naya two brand of mixer-grinder available in the market. Purana was introduced in 1990 and Naya was introduced in 1997. For both brands, 20% of the mixer-grinder bought in a particular year are disposed off as junk exactly two year later. It is known that 10 Purana mixer-grinder were disposed off in 1997. The following chart show the operation from 1995 to 2000, as at end of the year.

How many Purana mixer-grinder disposed off in 2000?

How many Purana mixer-grinder disposed off in 2000?
Solution:
Since, information of Purana mixer-grinder is not given for the even-numbered years (1996, 1998, etc), the number of mixer-grinder disposed off in 2000 cannot determined.
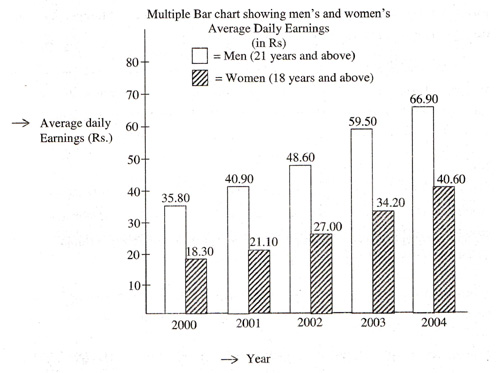
13. The following is a multiple bar chart showing men's and women's average daily earnings in certain industries. Study the chart and answer the questions given below.

In which year is the percentage increase in the average daily earnings of men over the preceding year, the maximum ?
Thus, maximum increase in daily earning of men over preceding year is in 2003

In which year is the percentage increase in the average daily earnings of men over the preceding year, the maximum ?
Solution:
Thus, maximum increase in daily earning of men over preceding year is in 2003
14. The following is a multiple bar chart showing men's and women's average daily earnings in certain industries. Study the chart and answer the questions given below.

The difference between the average daily earnings of men and women over successive years :
= 35.8 - 18.3
= 17.5
Difference between earning of man and women in 2001,
= 40.90 - 21.10
= 19.8
Difference between earning of man and women in 2002,
= 48.60 - 27.0
= 21.6
Difference between earning of man and women in 2003,
= 59.50 - 34.20
= 25.3
Difference between earning of man and women in 2004,
= 66.90 - 40.60
= 26.3
pattern show, its increasing.

The difference between the average daily earnings of men and women over successive years :
Solution:
Difference between earning of man and women in 2000,= 35.8 - 18.3
= 17.5
Difference between earning of man and women in 2001,
= 40.90 - 21.10
= 19.8
Difference between earning of man and women in 2002,
= 48.60 - 27.0
= 21.6
Difference between earning of man and women in 2003,
= 59.50 - 34.20
= 25.3
Difference between earning of man and women in 2004,
= 66.90 - 40.60
= 26.3
pattern show, its increasing.
15. The following is a multiple bar chart showing men's and women's average daily earnings in certain industries. Study the chart and answer the questions given below.

In which year is the ratio of men's average daily earnings to women's average daily earnings is the highest ?
=
= 1.95
Required ration in 2001,
=
= 1.93
Required ration in 2002,
=
= 1.8
Required ration in 2003,
=
= 1.73
Required ration in 2004,
=
= 1.64
It is highest in 2000

In which year is the ratio of men's average daily earnings to women's average daily earnings is the highest ?
Solution:
Required ratio in 2000,=
= 1.95
Required ration in 2001,
=
= 1.93
Required ration in 2002,
=
= 1.8
Required ration in 2003,
=
= 1.73
Required ration in 2004,
=
= 1.64
It is highest in 2000
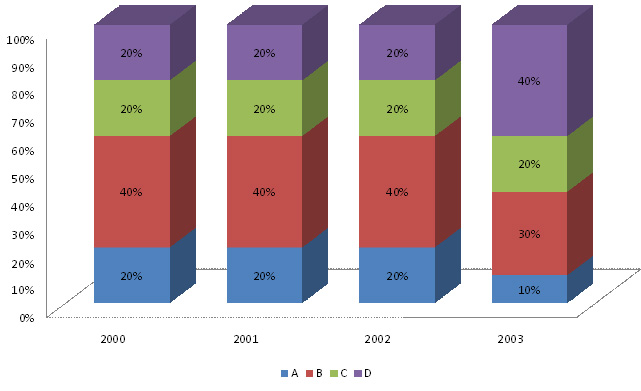
16. The cumulative bar chart below gives us the production of four Products A, B, C and D for four years. It is known that the total production increases @20% over its value in the previous year. The difference between C's production in 2003 and A's production in 2001 is 2640 units.
Production of A, B, C and D.

If the price of B is Rs. 125 per unit, what is the sales revenue in the same year due to sale of B (in Rupees Lakhs)?
Then,
0.2 × 17280 - 0.2 × 12000 = 1056
But this difference is given as 2640. Hence, the value of production will be; 25000, 30000, 36000, and 43200 respectively for the 4 years.
∴ Revenue
= 125 × 0.4 × 30000
= 1500000
Production of A, B, C and D.

If the price of B is Rs. 125 per unit, what is the sales revenue in the same year due to sale of B (in Rupees Lakhs)?
Solution:
Assume the total production of the first year as 10000, second year becomes 12000, third year 14400 and fourth year 17280.Then,
0.2 × 17280 - 0.2 × 12000 = 1056
But this difference is given as 2640. Hence, the value of production will be; 25000, 30000, 36000, and 43200 respectively for the 4 years.
∴ Revenue
= 125 × 0.4 × 30000
= 1500000
17. The cumulative bar chart below gives us the production of four Products A, B, C and D for four years. It is known that the total production increases @20% over its value in the previous year. The difference between C's production in 2003 and A's production in 2001 is 2640 units.
Production of A, B, C and D.

Assuming no pile up of inventory at the beginning or the end of the year, what is the ratio of the number of units of C produced in these four years?
Then,
0.2 × 17280 - 0.2 × 12000 = 1056
But this difference is given as 2640. Hence, the value of production will be; 25000, 30000, 36000, and 43200 respectively for the 4 years.
Ratio of the number of units C produced in four year,
= 0.2 × 25000 : 0.2 × 30000 : 0.2 × 36000 : 0.2 × 43200
= 250 : 300 : 360 : 432
= 175 : 150 : 180 : 216
Production of A, B, C and D.

Assuming no pile up of inventory at the beginning or the end of the year, what is the ratio of the number of units of C produced in these four years?
Solution:
Assume the total production of the first year as 10000, second year becomes 12000, third year 14400 and fourth year 17280.Then,
0.2 × 17280 - 0.2 × 12000 = 1056
But this difference is given as 2640. Hence, the value of production will be; 25000, 30000, 36000, and 43200 respectively for the 4 years.
Ratio of the number of units C produced in four year,
= 0.2 × 25000 : 0.2 × 30000 : 0.2 × 36000 : 0.2 × 43200
= 250 : 300 : 360 : 432
= 175 : 150 : 180 : 216
18. The cumulative bar chart below gives us the production of four Products A, B, C and D for four years. It is known that the total production increases @20% over its value in the previous year. The difference between C's production in 2003 and A's production in 2001 is 2640 units.
Production of A, B, C and D.

If the price of four products is in ratio of 3 : 5 : 7 : 8, what is the ratio of the ratio of the revenue generated by these products in 2002?
Then,
0.2 × 17280 - 0.2 × 12000 = 1056
But this difference is given as 2640. Hence, the value of production will be; 25000, 30000, 36000, and 43200 respectively for the 4 years.
Ratio of revenue generated in 2002,
= 2 × 3 : 4 × 5 : 2 × 7 : 2 × 8
= 6 : 20 : 14 : 16
= 3 : 10 : 7 : 8
Production of A, B, C and D.

If the price of four products is in ratio of 3 : 5 : 7 : 8, what is the ratio of the ratio of the revenue generated by these products in 2002?
Solution:
Assume the total production of the first year as 10000, second year becomes 12000, third year 14400 and fourth year 17280.Then,
0.2 × 17280 - 0.2 × 12000 = 1056
But this difference is given as 2640. Hence, the value of production will be; 25000, 30000, 36000, and 43200 respectively for the 4 years.
Ratio of revenue generated in 2002,
= 2 × 3 : 4 × 5 : 2 × 7 : 2 × 8
= 6 : 20 : 14 : 16
= 3 : 10 : 7 : 8
19. The cumulative bar chart below gives us the production of four Products A, B, C and D for four years. It is known that the total production increases @20% over its value in the previous year. The difference between C's production in 2003 and A's production in 2001 is 2640 units.
Production of A, B, C and D.

If due to extra set up time required, the production in 2001 drops by 12.5% over that in 2000, what should be the growth rate of production in 2002 to maintain the compounded annual growth rate (CAGR) of 20% (Approx)?
Then,
0.2 × 17280 - 0.2 × 12000 = 1056
But this difference is given as 2640. Hence, the value of production will be; 25000, 30000, 36000, and 43200 respectively for the 4 years.
Growth rate of production
=
= 65% (approx)
Production of A, B, C and D.

If due to extra set up time required, the production in 2001 drops by 12.5% over that in 2000, what should be the growth rate of production in 2002 to maintain the compounded annual growth rate (CAGR) of 20% (Approx)?
Solution:
Assume the total production of the first year as 10000, second year becomes 12000, third year 14400 and fourth year 17280.Then,
0.2 × 17280 - 0.2 × 12000 = 1056
But this difference is given as 2640. Hence, the value of production will be; 25000, 30000, 36000, and 43200 respectively for the 4 years.
Growth rate of production
=
= 65% (approx)
20. The cumulative bar chart below gives us the production of four Products A, B, C and D for four years. It is known that the total production increases @20% over its value in the previous year. The difference between C's production in 2003 and A's production in 2001 is 2640 units.
Production of A, B, C and D.

Which of the following is Not true?
Production of A, B, C and D.

Which of the following is Not true?
Solution:
Statement C is not true, since both A and B have not shown an increasing trend.