Home > Practice > Data Interpretation > Bar Graphs > Miscellaneous
41. Study the following bar graph and the table carefully and answer the questions given below:
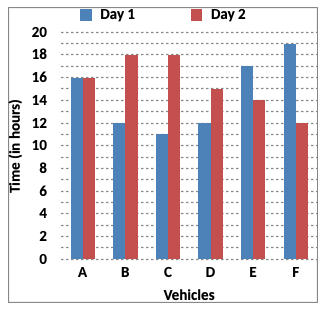
Time Taken (in hours) by 6 Vehicles on Two Different Days

Distance Covered (in km) by 6 Vehicles on Each Day
What was the speed of vehicles C on Day 2 in terms of metres per second ?
Time Taken (in hours) by 6 Vehicles on Two Different Days

Distance Covered (in km) by 6 Vehicles on Each Day
| Vehicles | Day 1 | Day 2 |
| A | 832 | 864 |
| B | 516 | 774 |
| C | 693 | 810 |
| D | 552 | 765 |
| E | 935 | 546 |
| F | 703 | 636 |
What was the speed of vehicles C on Day 2 in terms of metres per second ?
Solution:
42. Study the following bar graph and the table carefully and answer the questions given below:
Time Taken (in hours) by 6 Vehicles on Two Different Days

Distance Covered (in km) by 6 Vehicles on Each Day
What is the ratio of the speeds of vehicle D and vehicle E on Day 2?
Time Taken (in hours) by 6 Vehicles on Two Different Days

Distance Covered (in km) by 6 Vehicles on Each Day
| Vehicles | Day 1 | Day 2 |
| A | 832 | 864 |
| B | 516 | 774 |
| C | 693 | 810 |
| D | 552 | 765 |
| E | 935 | 546 |
| F | 703 | 636 |
What is the ratio of the speeds of vehicle D and vehicle E on Day 2?
Solution:
43. Study the following bar graph and the table carefully and answer the questions given below:
Time Taken (in hours) by 6 Vehicles on Two Different Days

Distance Covered (in km) by 6 Vehicles on Each Day
What was the difference between the speed of vehicles A on Day 1 and the speed of vehicles C on the same day ?
Difference between the speed of A on Day 1 and speed of C on Day 1
= (63 - 52) km/hr
= 11 km/hr
Time Taken (in hours) by 6 Vehicles on Two Different Days

Distance Covered (in km) by 6 Vehicles on Each Day
| Vehicles | Day 1 | Day 2 |
| A | 832 | 864 |
| B | 516 | 774 |
| C | 693 | 810 |
| D | 552 | 765 |
| E | 935 | 546 |
| F | 703 | 636 |
What was the difference between the speed of vehicles A on Day 1 and the speed of vehicles C on the same day ?
Solution:
Difference between the speed of A on Day 1 and speed of C on Day 1
= (63 - 52) km/hr
= 11 km/hr
44. Study the following bar graph and the table carefully and answer the questions given below:
Time Taken (in hours) by 6 Vehicles on Two Different Days

Distance Covered (in km) by 6 Vehicles on Each Day
The distance travelled by vehicle F on Day 2 was approximately what percent of the distance travelled by it on Day 1?
Time Taken (in hours) by 6 Vehicles on Two Different Days

Distance Covered (in km) by 6 Vehicles on Each Day
| Vehicles | Day 1 | Day 2 |
| A | 832 | 864 |
| B | 516 | 774 |
| C | 693 | 810 |
| D | 552 | 765 |
| E | 935 | 546 |
| F | 703 | 636 |
The distance travelled by vehicle F on Day 2 was approximately what percent of the distance travelled by it on Day 1?
Solution:
45. Study the bar chart given below and answer the following questions:
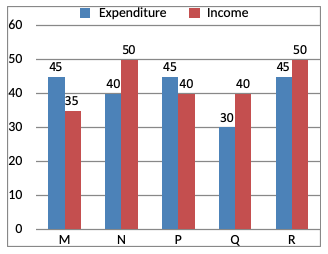
Income and Expenditure (in Rs. crore) in 2001 of five companies

The company earning the maximum percentage of profit in the year 2001 is:
Income and Expenditure (in Rs. crore) in 2001 of five companies

The company earning the maximum percentage of profit in the year 2001 is:
Solution:
46. Study the bar chart given below and answer the following questions:
Income and Expenditure (in Rs. crore) in 2001 of five companies

In 2001, the approximate percentage of profit/loss of all the five companies taken together is equal to-
= Rs. (35 + 50 + 40 + 40 + 50) crores
= Rs. 215 crores
Total expenditure of all the five companies
= Rs. (45 + 40 + 45 + 30 + 45) crores
= Rs. 205 crores
Income and Expenditure (in Rs. crore) in 2001 of five companies

In 2001, the approximate percentage of profit/loss of all the five companies taken together is equal to-
Solution:
Total income of all the five companies= Rs. (35 + 50 + 40 + 40 + 50) crores
= Rs. 215 crores
Total expenditure of all the five companies
= Rs. (45 + 40 + 45 + 30 + 45) crores
= Rs. 205 crores
47. Study the bar chart given below and answer the following questions:
Income and Expenditure (in Rs. crore) in 2001 of five companies

For company R if the expenditure had increased by 20% in the year 2001 from the year 2000 and the company had earned profit of 10% in 2000, the company’s income in 2000 was (in Rs. crore).
Let the income of company in 2000 be Rs. crores
Income and Expenditure (in Rs. crore) in 2001 of five companies

For company R if the expenditure had increased by 20% in the year 2001 from the year 2000 and the company had earned profit of 10% in 2000, the company’s income in 2000 was (in Rs. crore).
Solution:
Expenditure of company R in 2000Let the income of company in 2000 be Rs. crores
48. Study the bar chart given below and answer the following questions:
Income and Expenditure (in Rs. crore) in 2001 of five companies

If the income of company Q in 2001 was 10% more than that in 2000 and the company had earned a profit of 20% in 2000, then its expenditure in 2000 (in Rs. crore).
Income and Expenditure (in Rs. crore) in 2001 of five companies

If the income of company Q in 2001 was 10% more than that in 2000 and the company had earned a profit of 20% in 2000, then its expenditure in 2000 (in Rs. crore).
Solution:
49. Study the bar chart given below and answer the following questions:
Income and Expenditure (in Rs. crore) in 2001 of five companies

The companies M and N together had a percentage of profit/ loss of -
= Rs. (35 + 50) crores
= Rs. 85 crores
Total expenditure
= Rs. (45 + 40) crores
= Rs. 85 crores
Hence, the companies M and N had no loss and no profit.
Income and Expenditure (in Rs. crore) in 2001 of five companies

The companies M and N together had a percentage of profit/ loss of -
Solution:
Total income of companies M and N= Rs. (35 + 50) crores
= Rs. 85 crores
Total expenditure
= Rs. (45 + 40) crores
= Rs. 85 crores
Hence, the companies M and N had no loss and no profit.
50. Study the following graph carefully to answer the questions that follow:
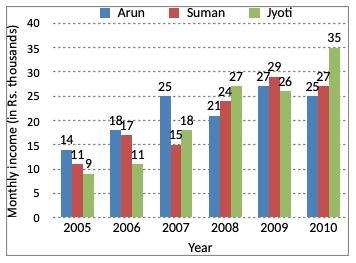
Monthly income (Rs. in thousands) of three different persons in six different years

What was the different between the total monthly salary of Arun in all the years together and Suman’s monthly income in the year 2007?
= 14000 + 18000 + 23000 + 21000 + 27000 + 25000
= Rs. 128000
Monthly salary of Suman in the year 2007 = Rs. 15000
Difference between their Salary
= 128000 - 15000
= Rs. 1.13 lakh
Monthly income (Rs. in thousands) of three different persons in six different years

What was the different between the total monthly salary of Arun in all the years together and Suman’s monthly income in the year 2007?
Solution:
Total monthly salary of Arun in all the years= 14000 + 18000 + 23000 + 21000 + 27000 + 25000
= Rs. 128000
Monthly salary of Suman in the year 2007 = Rs. 15000
Difference between their Salary
= 128000 - 15000
= Rs. 1.13 lakh