Home > Practice > Data Interpretation > Bar Graphs > Miscellaneous
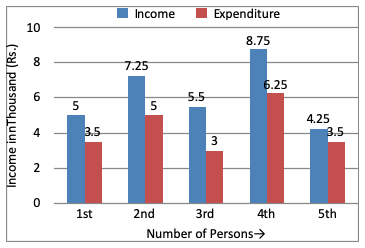
91. In the following questions, a graphical representation of income and expenditure of 5 persons during the month of January has been given. Read the graph and answer the questions.

What is the average income of five persons per month?
Average = thousand
= Rs. 6.15 thousand
= Rs. 6150

What is the average income of five persons per month?
Solution:
Total income = Rs. 30.75 thousandAverage = thousand
= Rs. 6.15 thousand
= Rs. 6150
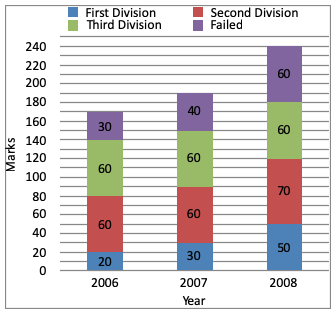
92. The subdivided bar diagram given below depicts the result of B.com students of a college for 3 years. Study the graph and answer the given questions.

What was the number of third division in 2006?
= 140 - 80
= 60

What was the number of third division in 2006?
Solution:
Students who passed in third division in 2006= 140 - 80
= 60
93. The subdivided bar diagram given below depicts the result of B.com students of a college for 3 years. Study the graph and answer the given questions.

How many percent of students passed in first division in 2007?
Students who passed in first division = 30
∴ Required percent

How many percent of students passed in first division in 2007?
Solution:
Total Number of students in year 2007 = 190Students who passed in first division = 30
∴ Required percent
94. The subdivided bar diagram given below depicts the result of B.com students of a college for 3 years. Study the graph and answer the given questions.

In which year, did the college have the best result for B.com?

In which year, did the college have the best result for B.com?
Solution:
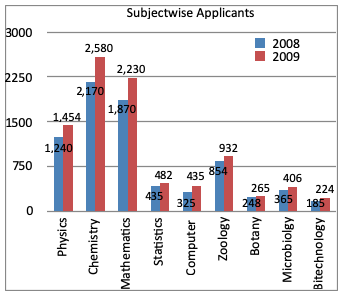
95. The subject wise number of applicants for the year 2008 and 2009 in a college is given in the following chart. study the graph and answer the questions.

The number of physics seeking applicants increase by:

The number of physics seeking applicants increase by:
Solution:
96. The subject wise number of applicants for the year 2008 and 2009 in a college is given in the following chart. study the graph and answer the questions.

The subject for which demand is maximum:

The subject for which demand is maximum:
Solution:
Maximum demand is Chemistry subject.
97. The subject wise number of applicants for the year 2008 and 2009 in a college is given in the following chart. study the graph and answer the questions.

The number of Mathematics seeking applicants increased by:

The number of Mathematics seeking applicants increased by:
Solution:
98. The subject wise number of applicants for the year 2008 and 2009 in a college is given in the following chart. study the graph and answer the questions.

The number of Chemistry seeking applicants increased by:

The number of Chemistry seeking applicants increased by:
Solution:
99. The subject wise number of applicants for the year 2008 and 2009 in a college is given in the following chart. study the graph and answer the questions.

The subject for which demand is minimum:

The subject for which demand is minimum:
Solution:
Minimum demand is Botany subject.
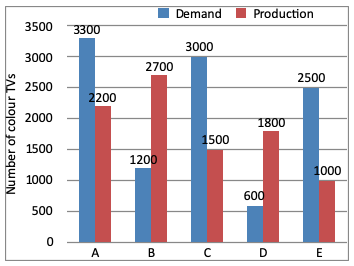
100. Study the bar diagram and answer the following questions.
Demand and production of colour TV of five companies A, B, C, D, and E.

The difference between average demand and average production of the five companies taken together is:
=
= 2120 - 1840
= 280
Demand and production of colour TV of five companies A, B, C, D, and E.

The difference between average demand and average production of the five companies taken together is:
Solution:
Required difference=
= 2120 - 1840
= 280