Home > Practice > Data Interpretation > Bar Graphs > Miscellaneous
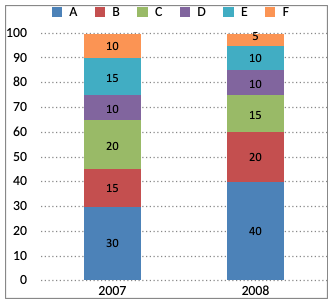
81. The bar chart given below shows the percentage distribution of the production of various models of a mobile manufacturing company in 2007 and 2008. The total production in 2007 was 35 lakh mobile phones and in 2008 the production was 44 lakh. Study the chart and answer the following questions.
Percentage of six different types of mobiles manufactured by a company over two year.

Total number of mobiles of models A, B and E manufactured in 2007 was?
Percentage of six different types of mobiles manufactured by a company over two year.

Total number of mobiles of models A, B and E manufactured in 2007 was?
Solution:
82. The bar chart given below shows the percentage distribution of the production of various models of a mobile manufacturing company in 2007 and 2008. The total production in 2007 was 35 lakh mobile phones and in 2008 the production was 44 lakh. Study the chart and answer the following questions.
Percentage of six different types of mobiles manufactured by a company over two year.

If the percentage production of A type mobiles in 2008 as name as that in 2007, then the number of A type mobiles produced in 2008 would have been-
= lakhs
= 13,20,000
Percentage of six different types of mobiles manufactured by a company over two year.

If the percentage production of A type mobiles in 2008 as name as that in 2007, then the number of A type mobiles produced in 2008 would have been-
Solution:
Required Production= lakhs
= 13,20,000
83. The bar chart given below shows the percentage distribution of the production of various models of a mobile manufacturing company in 2007 and 2008. The total production in 2007 was 35 lakh mobile phones and in 2008 the production was 44 lakh. Study the chart and answer the following questions.
Percentage of six different types of mobiles manufactured by a company over two year.

For which models was the percentage variation in production from 2007 to 2008 the maximum?
Percentage of six different types of mobiles manufactured by a company over two year.

For which models was the percentage variation in production from 2007 to 2008 the maximum?
Solution:
84. The bar chart given below shows the percentage distribution of the production of various models of a mobile manufacturing company in 2007 and 2008. The total production in 2007 was 35 lakh mobile phones and in 2008 the production was 44 lakh. Study the chart and answer the following questions.
Percentage of six different types of mobiles manufactured by a company over two year.

What was the difference in the number of B type mobile produced in 2007 and 2008?
B type mobile production in 2008 =
Required Difference
Percentage of six different types of mobiles manufactured by a company over two year.

What was the difference in the number of B type mobile produced in 2007 and 2008?
Solution:
B types mobile production in 2007 = B type mobile production in 2008 =
Required Difference
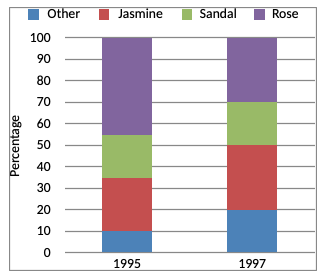
85. The production figures of a perfume manufacturer are given in the form of percentage in sub-divided are diagram. Study the diagram and answer the questions.

What is the production of jasmine perfume in the year 1997? Given that during the year 1997 total perfumed production was 5000 units.
30% of 5000 = × 5000 = 1500

What is the production of jasmine perfume in the year 1997? Given that during the year 1997 total perfumed production was 5000 units.
Solution:
Production of jasmine perfume in 1997 = 30%30% of 5000 = × 5000 = 1500
86. The production figures of a perfume manufacturer are given in the form of percentage in sub-divided are diagram. Study the diagram and answer the questions.

What is the ratio of percentage production of rose perfume during 1995 to that during the year 1997?
= 45 : 30
= 3 : 2

What is the ratio of percentage production of rose perfume during 1995 to that during the year 1997?
Solution:
Required ratio= 45 : 30
= 3 : 2
87. The production figures of a perfume manufacturer are given in the form of percentage in sub-divided are diagram. Study the diagram and answer the questions.

What is the percentage of production of sandal perfume during the year 1995 over that during 1997?
Production of sandal perfume in 1997 = 20%
Required Ratio = = 1

What is the percentage of production of sandal perfume during the year 1995 over that during 1997?
Solution:
Production of sandal perfume in 1995 = 20%Production of sandal perfume in 1997 = 20%
Required Ratio = = 1
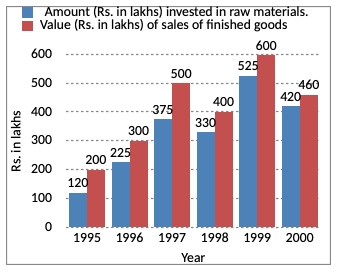
88. Study the following graph and answer the given questions.

What was the difference between the average amount invested in raw materials during the given period and the average value of sales of finished goods during this period?
(120 + 225 + 375 + 330 + 525 + 420)

What was the difference between the average amount invested in raw materials during the given period and the average value of sales of finished goods during this period?
Solution:
Average of total investment(120 + 225 + 375 + 330 + 525 + 420)
89. Study the following graph and answer the given questions.

In which year, there has been a maximum percentage increase in the amount invested in raw materials as compared to the previous year?
= × 100 = 87.5%
Percentage increase in year 1997
= × 100 = 67%

In which year, there has been a maximum percentage increase in the amount invested in raw materials as compared to the previous year?
Solution:
Percentage increase in year 1996= × 100 = 87.5%
Percentage increase in year 1997
= × 100 = 67%
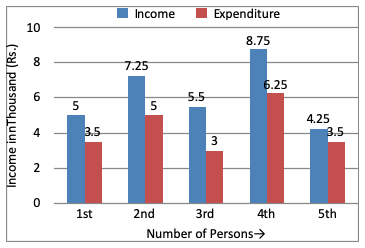
90. In the following questions, a graphical representation of income and expenditure of 5 persons during the month of January has been given. Read the graph and answer the questions.

What is the income range of the five persons?

What is the income range of the five persons?
Solution:
Income range of the person (4.25 - 8.75)