Home > Practice > Data Interpretation > Bar Graphs > Miscellaneous
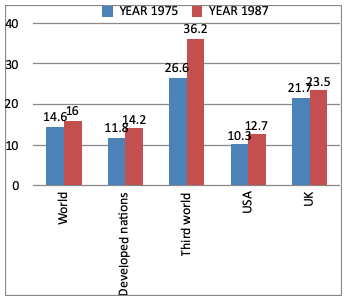
141. Study the following bar graph and answer the questions. The Bar graph gives the annual rates of inflation in percentage for 1975 and 1987.

The change in rate of inflation was least in which of the following.
= 16 - 14.6
= 1.4

The change in rate of inflation was least in which of the following.
Solution:
From graph it is clear that minimum charge of rate is for world= 16 - 14.6
= 1.4
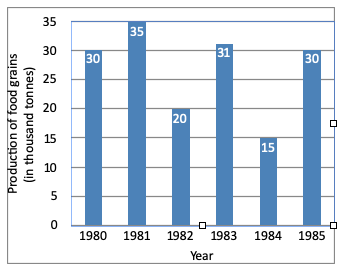
142. The graph shows the production of food grains of a country in different. Study the graph and answer the questions.

The two consecutive years in which rate of change of production of food grains is minimum are.

The two consecutive years in which rate of change of production of food grains is minimum are.
Solution:
From graph it is clear two consecutive years in which rate of change is minimum are 1980 and 1981.
143. The graph shows the production of food grains of a country in different. Study the graph and answer the questions.

The difference of the production of food grains for the year 1981 and 1985 is:
= 35 - 30
= 5 × 1000
= 5000 tonnes

The difference of the production of food grains for the year 1981 and 1985 is:
Solution:
Difference of production of 1981 and 1985= 35 - 30
= 5 × 1000
= 5000 tonnes
144. The graph shows the production of food grains of a country in different. Study the graph and answer the questions.

The percentage increase in production from 1984 to 1985 was.

The percentage increase in production from 1984 to 1985 was.
Solution:
145. The graph shows the production of food grains of a country in different. Study the graph and answer the questions.

The sum of the production of food grains in the year 1982 and 1984 is equal to that in the year:
Sum of 1982 and 1984
= 20 + 15
= 35
Which is equal to the production of 1981

The sum of the production of food grains in the year 1982 and 1984 is equal to that in the year:
Solution:
From the graph:Sum of 1982 and 1984
= 20 + 15
= 35
Which is equal to the production of 1981
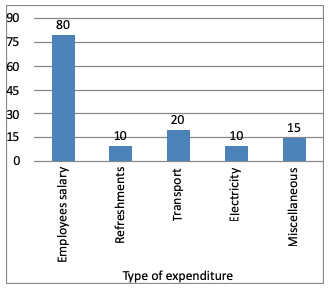
146. The graph shows the monthly expenditure of a company ( unit = 10 lakh). Study the graph and answer the questions.

The ratio between transport and employee salary on monthly basis is.
= 20 : 80
= 1 : 4

The ratio between transport and employee salary on monthly basis is.
Solution:
Ratio of Transport : Ratio of Employee salary= 20 : 80
= 1 : 4
147. The graph shows the monthly expenditure of a company ( unit = 10 lakh). Study the graph and answer the questions.

The fraction of money spent on refreshments is-

The fraction of money spent on refreshments is-
Solution:
The fraction of money spent on refreshment
148. The graph shows the monthly expenditure of a company ( unit = 10 lakh). Study the graph and answer the questions.

The percentage of money spent on miscellaneous is:

The percentage of money spent on miscellaneous is:
Solution:
149. The graph shows the monthly expenditure of a company ( unit = 10 lakh). Study the graph and answer the questions.

The total monthly expenditure of the company is:
= Employees Salary + Refreshment + Transport + Electricity + Miscellaneous
= 80 + 10 + 20 + 10 + 15
= 135 Lakh

The total monthly expenditure of the company is:
Solution:
Total expenditure of the company= Employees Salary + Refreshment + Transport + Electricity + Miscellaneous
= 80 + 10 + 20 + 10 + 15
= 135 Lakh
Next