Home > Practice > Data Interpretation > Bar Graphs > Miscellaneous
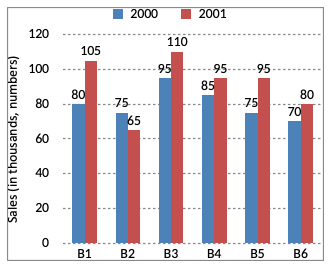
61. The bar graph given below shows the sales of books (in thousand numbers from six branches of a publishing company during two consecutive years 2000 and 2001. Sales of books (in thousands numbers) from six branches B1, B2, B3, B4, B5 and B6 of a publishing company in 2000 and 2001.

Total sales branches B1, B3 and B5 together for both the years (in thousands number) is?
= (80 + 105) + (95 + 110) + (75 + 95)
= 560

Total sales branches B1, B3 and B5 together for both the years (in thousands number) is?
Solution:
Total sales of branches B1, B3 and B5 for both the years (in thousands numbers)= (80 + 105) + (95 + 110) + (75 + 95)
= 560
62. The bar graph given below shows the sales of books (in thousand numbers from six branches of a publishing company during two consecutive years 2000 and 2001. Sales of books (in thousands numbers) from six branches B1, B2, B3, B4, B5 and B6 of a publishing company in 2000 and 2001.

What is the ratio of the total sales of branch B2 for both years to the total sales branch B4 for both years?

What is the ratio of the total sales of branch B2 for both years to the total sales branch B4 for both years?
Solution:
Required ratio
63. The bar graph given below shows the sales of books (in thousand numbers from six branches of a publishing company during two consecutive years 2000 and 2001. Sales of books (in thousands numbers) from six branches B1, B2, B3, B4, B5 and B6 of a publishing company in 2000 and 2001.

What percent of the average sales branches B1, B2 and B3 in 2001 is the average sales of branches B1, B3 and B6 in 2000?
= 80 + 95 + 70
= 245
Average sales (in thousands number) of branches B1, B3 and B6 in 2000
=
Total sales (in thousands number) of branches B1, B2 and B3 in 2001
= 105 + 65 + 110
= 280
Average sales (in thousand number) of branches B1, B2 and B3 in 2001

What percent of the average sales branches B1, B2 and B3 in 2001 is the average sales of branches B1, B3 and B6 in 2000?
Solution:
Total sales (in thousand numbers) of branches B1, B3 and B6 in 2000= 80 + 95 + 70
= 245
Average sales (in thousands number) of branches B1, B3 and B6 in 2000
=
Total sales (in thousands number) of branches B1, B2 and B3 in 2001
= 105 + 65 + 110
= 280
Average sales (in thousand number) of branches B1, B2 and B3 in 2001
64. The bar graph given below shows the sales of books (in thousand numbers from six branches of a publishing company during two consecutive years 2000 and 2001. Sales of books (in thousands numbers) from six branches B1, B2, B3, B4, B5 and B6 of a publishing company in 2000 and 2001.

What is the average sales of all the branches (in thousands numbers) for the years 2000?
= 80 + 75 + 95 + 85 + 75 + 70
= 480
Average sales of all the six branches (in thousand numbers) for the year 2000

What is the average sales of all the branches (in thousands numbers) for the years 2000?
Solution:
Total sales of all the six branches (in thousand numbers) for the year 2000= 80 + 75 + 95 + 85 + 75 + 70
= 480
Average sales of all the six branches (in thousand numbers) for the year 2000
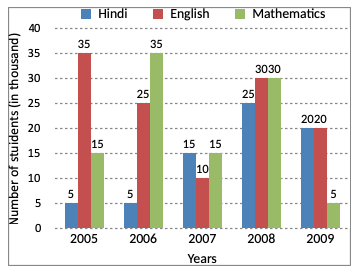
65. Study the following graph carefully and answer the questions that follow:
No. Of students (in thousands) who opted for Three Different Specializations during the Given Five Years in a University.

If the total number of students in the university in the year 2007 was 455030, the total number of students who opted for the given three subjects was approximately what percent of the total students?
Total number of students = 455030
Number of those choosing the given three subjects
= 15000 + 10000 + 15000
= 40000
∴ Required percentage
No. Of students (in thousands) who opted for Three Different Specializations during the Given Five Years in a University.

If the total number of students in the university in the year 2007 was 455030, the total number of students who opted for the given three subjects was approximately what percent of the total students?
Solution:
In 2007, we have:Total number of students = 455030
Number of those choosing the given three subjects
= 15000 + 10000 + 15000
= 40000
∴ Required percentage
66. Study the following graph carefully and answer the questions that follow:
No. Of students (in thousands) who opted for Three Different Specializations during the Given Five Years in a University.

What is the ratio of the number of students who opted for English in the years 2006 and 2008 together to the number of students who opted for Hindi in the years 2005 and 2009 together?
= (25 + 30) : (5 + 20)
= 55 : 25
= 11 : 5
No. Of students (in thousands) who opted for Three Different Specializations during the Given Five Years in a University.

What is the ratio of the number of students who opted for English in the years 2006 and 2008 together to the number of students who opted for Hindi in the years 2005 and 2009 together?
Solution:
Ratio of the number who opted for English in 2006 and 2008 to the number who opted for Hindi in 2005 and 2009= (25 + 30) : (5 + 20)
= 55 : 25
= 11 : 5
67. Study the following graph carefully and answer the questions that follow:
No. Of students (in thousands) who opted for Three Different Specializations during the Given Five Years in a University.

What is the total number of students who opted for Hindi and Mathematics in the years 2006, 2007 and 2009 together?
= {(5 + 35) + (15 + 15) + (20 + 5)} thousands
= 95000
No. Of students (in thousands) who opted for Three Different Specializations during the Given Five Years in a University.

What is the total number of students who opted for Hindi and Mathematics in the years 2006, 2007 and 2009 together?
Solution:
Number of students who opted Hindi and Mathematics in 2006, 2007 and 2009= {(5 + 35) + (15 + 15) + (20 + 5)} thousands
= 95000
68. Study the following graph carefully and answer the questions that follow:
No. Of students (in thousands) who opted for Three Different Specializations during the Given Five Years in a University.

Out of the total number of students who opted for the given three subjects in the year 2009, 38% were girls. How many boys opted for Mathematics in the same year?
= 20000 + 20000 + 5000
= 45000
Number of girls = 38% of 45000
= 45000 ×
= 17100
Out of these, the number of boys who opted for Mathematics cannot be found.
No. Of students (in thousands) who opted for Three Different Specializations during the Given Five Years in a University.

Out of the total number of students who opted for the given three subjects in the year 2009, 38% were girls. How many boys opted for Mathematics in the same year?
Solution:
Number of students who opted for the given three subjects in the year 2009 is= 20000 + 20000 + 5000
= 45000
Number of girls = 38% of 45000
= 45000 ×
= 17100
Out of these, the number of boys who opted for Mathematics cannot be found.
69. Study the following graph carefully and answer the questions that follow:
No. Of students (in thousands) who opted for Three Different Specializations during the Given Five Years in a University.

The total number of students who opted for Mathematics in the years 2005 and 2008 together is approximately what percent of the total number of students who opted for all three subjects in the same years?
= 15000 + 30000
= 45000
Number of students opting for these three subjects in 2005 and 2008
= {(5 + 35 + 15) + (25 + 30 + 30)} thousands
= 55000 + 85000
= 140000
No. Of students (in thousands) who opted for Three Different Specializations during the Given Five Years in a University.

The total number of students who opted for Mathematics in the years 2005 and 2008 together is approximately what percent of the total number of students who opted for all three subjects in the same years?
Solution:
Number of students opting Mathematics in 2005 and 2008= 15000 + 30000
= 45000
Number of students opting for these three subjects in 2005 and 2008
= {(5 + 35 + 15) + (25 + 30 + 30)} thousands
= 55000 + 85000
= 140000
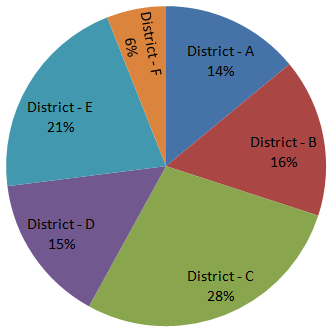
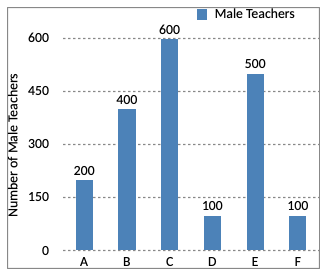
70. Study the following pie-chart and bar graph and answer the questions that follows:
Percentage-wise distribution of Teachers in 6 Districts.

Number of males in each district out of 4500 Teachers.

What is the total number of male teachers in District F, female teachers District C and female teachers in District B together?
Total number of male teacher in F, female teacher in C and female teacher in B
= 100 + 660 + 320
= 1080
Percentage-wise distribution of Teachers in 6 Districts.

Number of males in each district out of 4500 Teachers.

What is the total number of male teachers in District F, female teachers District C and female teachers in District B together?
Solution:
| A | B | C | D | E | F | |
| Males | 200 | 400 | 600 | 100 | 500 | 100 |
| Females | 430 | 320 | 660 | 575 | 445 | 170 |
Total number of male teacher in F, female teacher in C and female teacher in B
= 100 + 660 + 320
= 1080