Home > Practice > Data Interpretation > Bar Graphs > Miscellaneous
31. Study the following graph carefully and answer the questions given below:
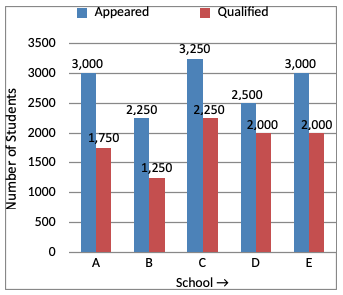
Total Number of Students Appeared and Qualified from Various Schools at a Scholarship Exam.

What is the difference between the average number of students appeared in the scholarship exam from all the given schools and the average number of students qualified from all the school together?
= (3000 + 2250 + 3250 + 2500 + 3000)
=
= 2800
Average number of students qualified from all the schools
= (1750 + 1250 + 2250 + 2000 + 2000)
=
= 1850
∴ Required difference
= 2800 - 1850
= 950
Total Number of Students Appeared and Qualified from Various Schools at a Scholarship Exam.

What is the difference between the average number of students appeared in the scholarship exam from all the given schools and the average number of students qualified from all the school together?
Solution:
Average number of students appeared from all the schools= (3000 + 2250 + 3250 + 2500 + 3000)
=
= 2800
Average number of students qualified from all the schools
= (1750 + 1250 + 2250 + 2000 + 2000)
=
= 1850
∴ Required difference
= 2800 - 1850
= 950
32. Study the following graph carefully and answer the questions given below:
Total Number of Students Appeared and Qualified from Various Schools at a Scholarship Exam.

What is the ratio of the number of students qualified in the scholarship examination from School A and the number of students qualified in the examination from School B?
Total Number of Students Appeared and Qualified from Various Schools at a Scholarship Exam.

What is the ratio of the number of students qualified in the scholarship examination from School A and the number of students qualified in the examination from School B?
Solution:
(Number of students qualified from A) : (Number of students qualified from B)
33. Study the following graph carefully and answer the questions given below:
Total Number of Students Appeared and Qualified from Various Schools at a Scholarship Exam.

The average number of students qualified in the examination from Schools C and D is what percent of the average number of students appeared for the examination from the same school? ( round off to 2 digits after decimal).
Average number of students appeared from C and D
Total Number of Students Appeared and Qualified from Various Schools at a Scholarship Exam.

The average number of students qualified in the examination from Schools C and D is what percent of the average number of students appeared for the examination from the same school? ( round off to 2 digits after decimal).
Solution:
Average number of students qualified from C and DAverage number of students appeared from C and D
34. Study the following graph carefully and answer the questions given below:
Total Number of Students Appeared and Qualified from Various Schools at a Scholarship Exam.

The number of students appeared for the scholarship exam from School D is approximately what percent of the total number of students appeared for the exam from all the school together?
Total Number of Students Appeared and Qualified from Various Schools at a Scholarship Exam.

The number of students appeared for the scholarship exam from School D is approximately what percent of the total number of students appeared for the exam from all the school together?
Solution:
Required %
35. Study the following bar-graph carefully and answer the questions given below:

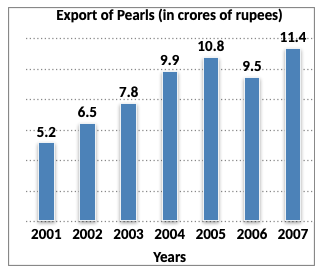
In how many years was the export above average for the given period?
If was above average in 2004, 2005, 2006 and 2007.
i.e. in 4 years

In how many years was the export above average for the given period?
Solution:
Average export during the given period = Rs. 8.73 crores.If was above average in 2004, 2005, 2006 and 2007.
i.e. in 4 years
36. Study the following bar-graph carefully and answer the questions given below:

What was the percentage increase in export from 2006 to 2007 ?

What was the percentage increase in export from 2006 to 2007 ?
Solution:
Percentage increase in export from 2006 to 2007.
37. Study the following bar-graph carefully and answer the questions given below:

The average export of pearls for the given period (in Rs. crores) was ?

The average export of pearls for the given period (in Rs. crores) was ?
Solution:
Average export of pearls over the period
38. Study the following bar-graph carefully and answer the questions given below:

In which of the following pairs of years was the average export of pearls around Rs. 9 crores?

In which of the following pairs of years was the average export of pearls around Rs. 9 crores?
Solution:
39. Study the following bar-graph carefully and answer the questions given below:

In which year was there maximum percentage increase in export of pearls to that in the previous year?
Clearly, the maximum increase was in 2004

In which year was there maximum percentage increase in export of pearls to that in the previous year?
Solution:
Clearly, the maximum increase was in 2004
40. Study the following bar graph and the table carefully and answer the questions given below:
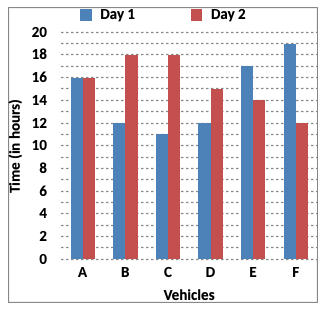
Time Taken (in hours) by 6 Vehicles on Two Different Days

Distance Covered (in km) by 6 Vehicles on Each Day
Which of the following vehicles travelled at the same speed on both the days?
Clearly B travelled at the same speed on both the days.
Time Taken (in hours) by 6 Vehicles on Two Different Days

Distance Covered (in km) by 6 Vehicles on Each Day
| Vehicles | Day 1 | Day 2 |
| A | 832 | 864 |
| B | 516 | 774 |
| C | 693 | 810 |
| D | 552 | 765 |
| E | 935 | 546 |
| F | 703 | 636 |
Which of the following vehicles travelled at the same speed on both the days?
Solution:
Clearly B travelled at the same speed on both the days.